Week 20:
A week of interesting things

Giorgia
What do we find compelling?
What are your interests? What do you enjoy reading or watching?
Those are pretty basic and common questions when you want to get to know somebody, and we somehow skipped this until week 20.
I remember I was happy when we came out with the topic because for sure this would tell a lot about ourselves, and I was incredibly looking forward to receiving Stefanie’s card and to see what is that gets her attention and focus.
This week I tracked all of the contents I found interesting in my media digest.
My normal way of stumbling upon compelling articles or pieces of media is daily composed of:
- checking my social media feed,
- going over a couple of very selected daily newsletters I subscribed to,
- listening to my fav podcasts,
- and of course getting links from my boyfriends or my friends (and eventually sending them my links).
I already knew it, but my postcard confirms it:
there are very limited topics that intrigue me, I almost never - …oh well let’s say never never - read about politics or economy or news stories. For most of my adult life so far I felt ashamed about it and pretended that I somehow was interested in those subjects the whole world cares about. But I recently came to terms with the fact that NO, I am so much not into those issues that I can barely read 10 lines of an article about politics before my mind jumps somewhere else while I still make it as if I was reading it.
The data drawing(s)
Last week Stefanie suggested something very clever: why don’t we challenge ourselves to evolve our drawing styles, going off the path, and using different materials such as collage or colors we wouldn’t use normally?
Well, you can tell how both (and immediately) picked the ‘collage’ suggestion.
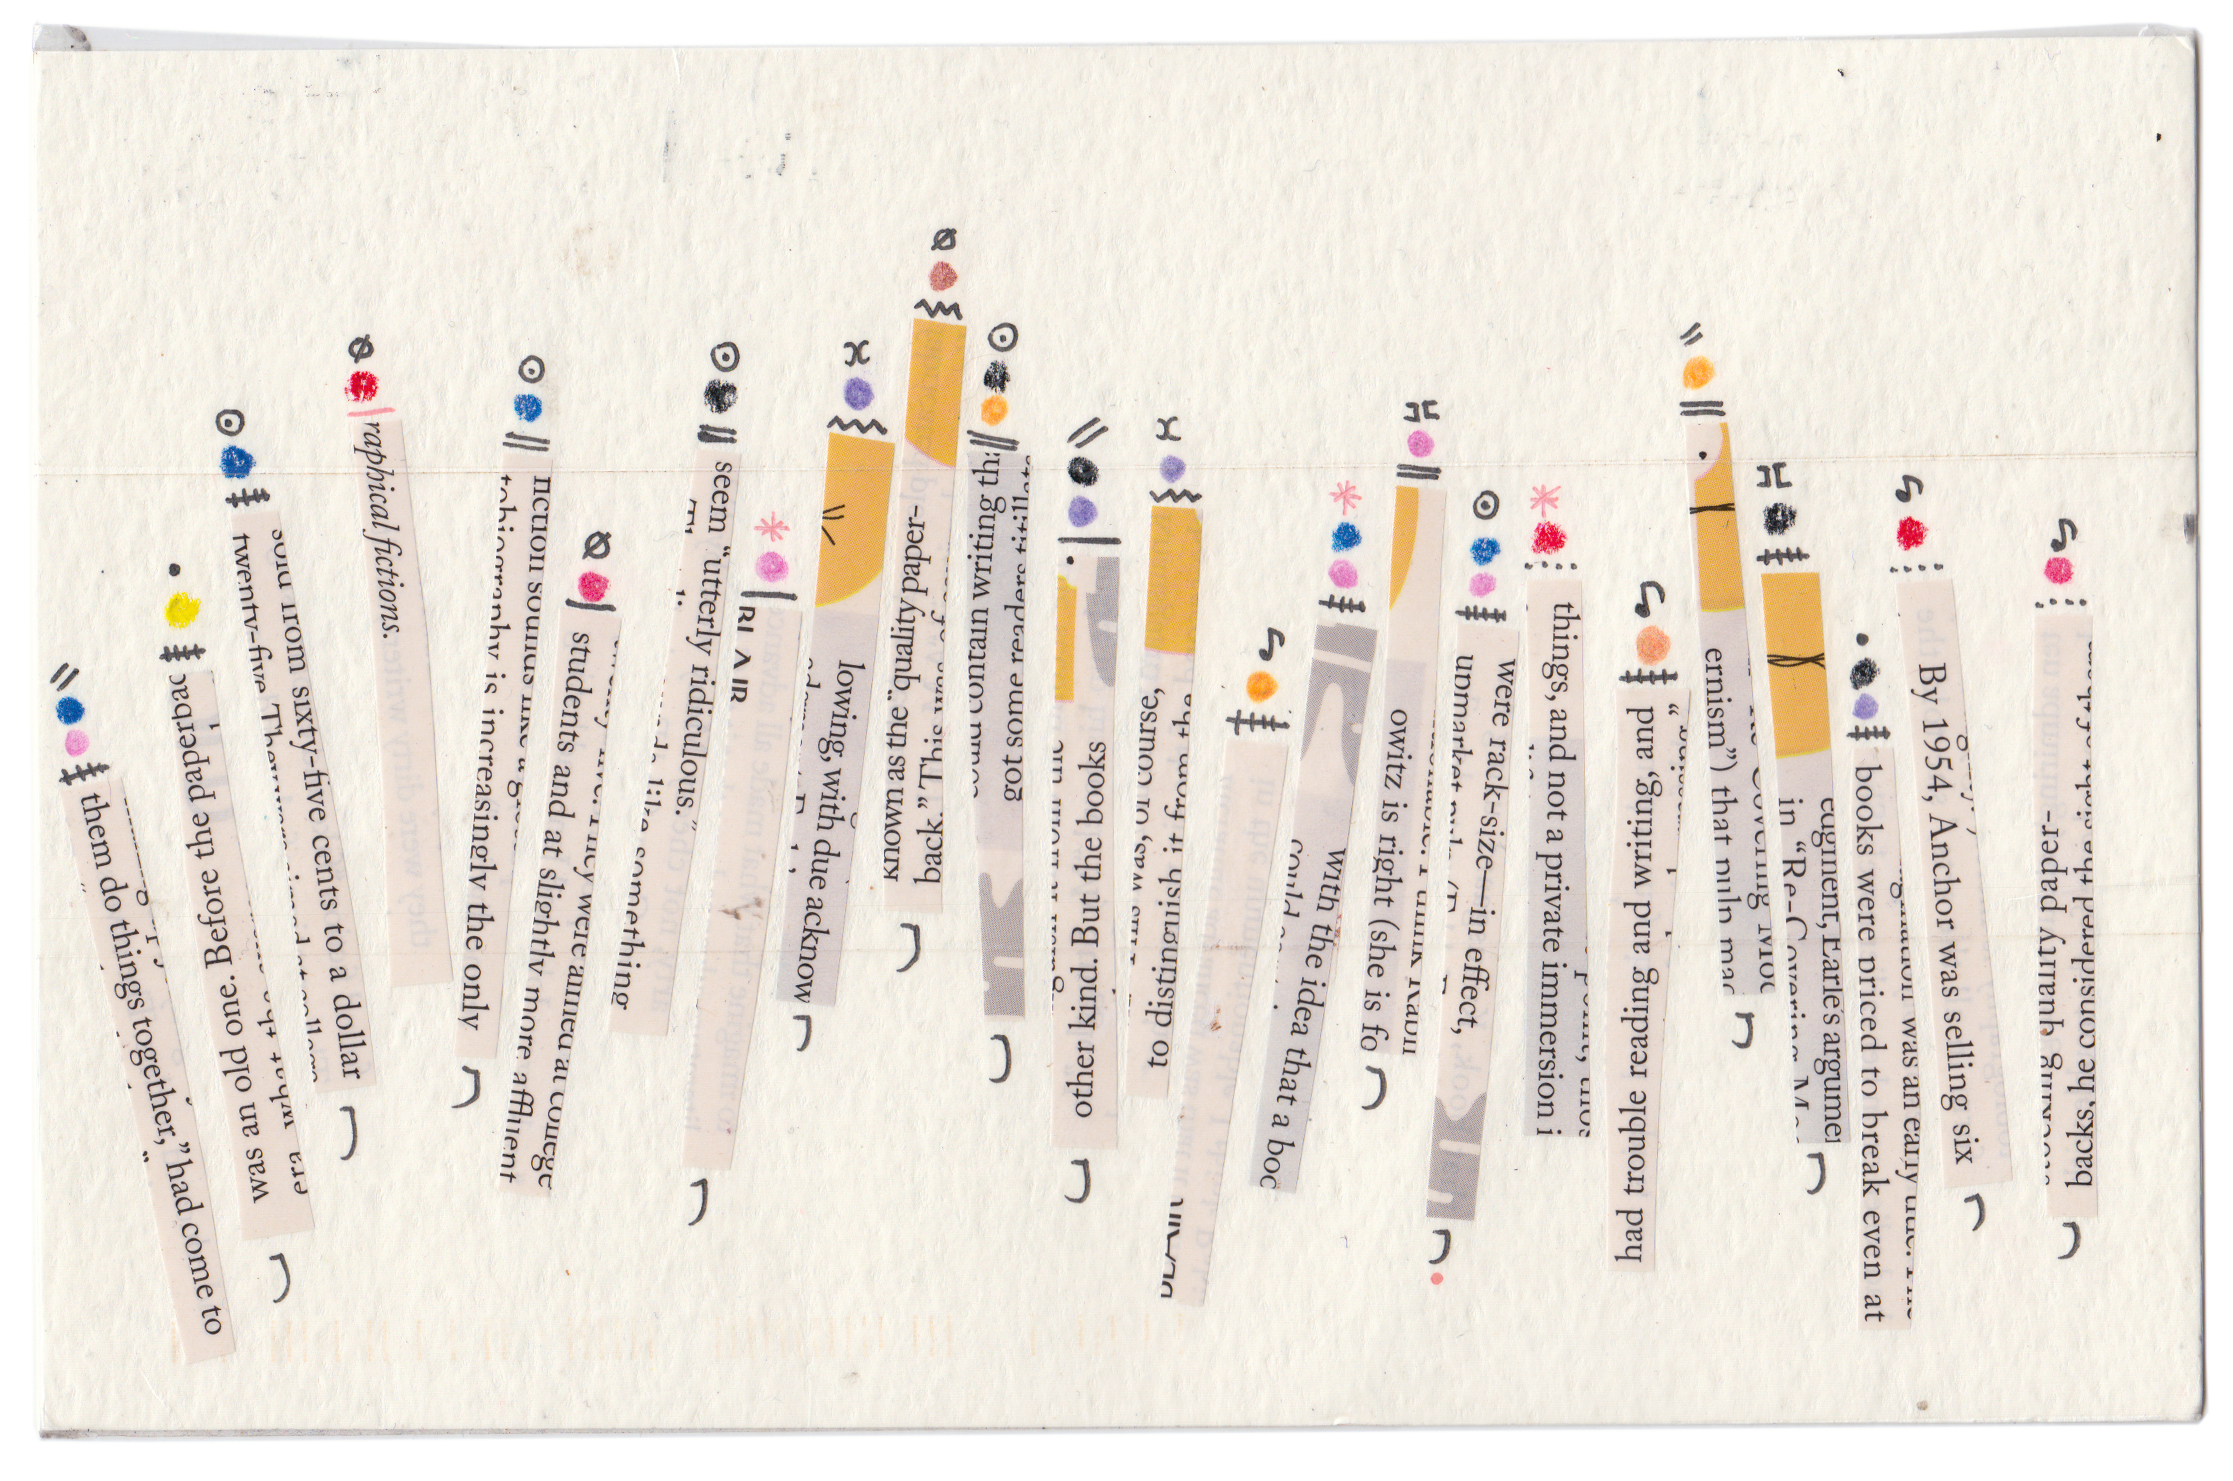
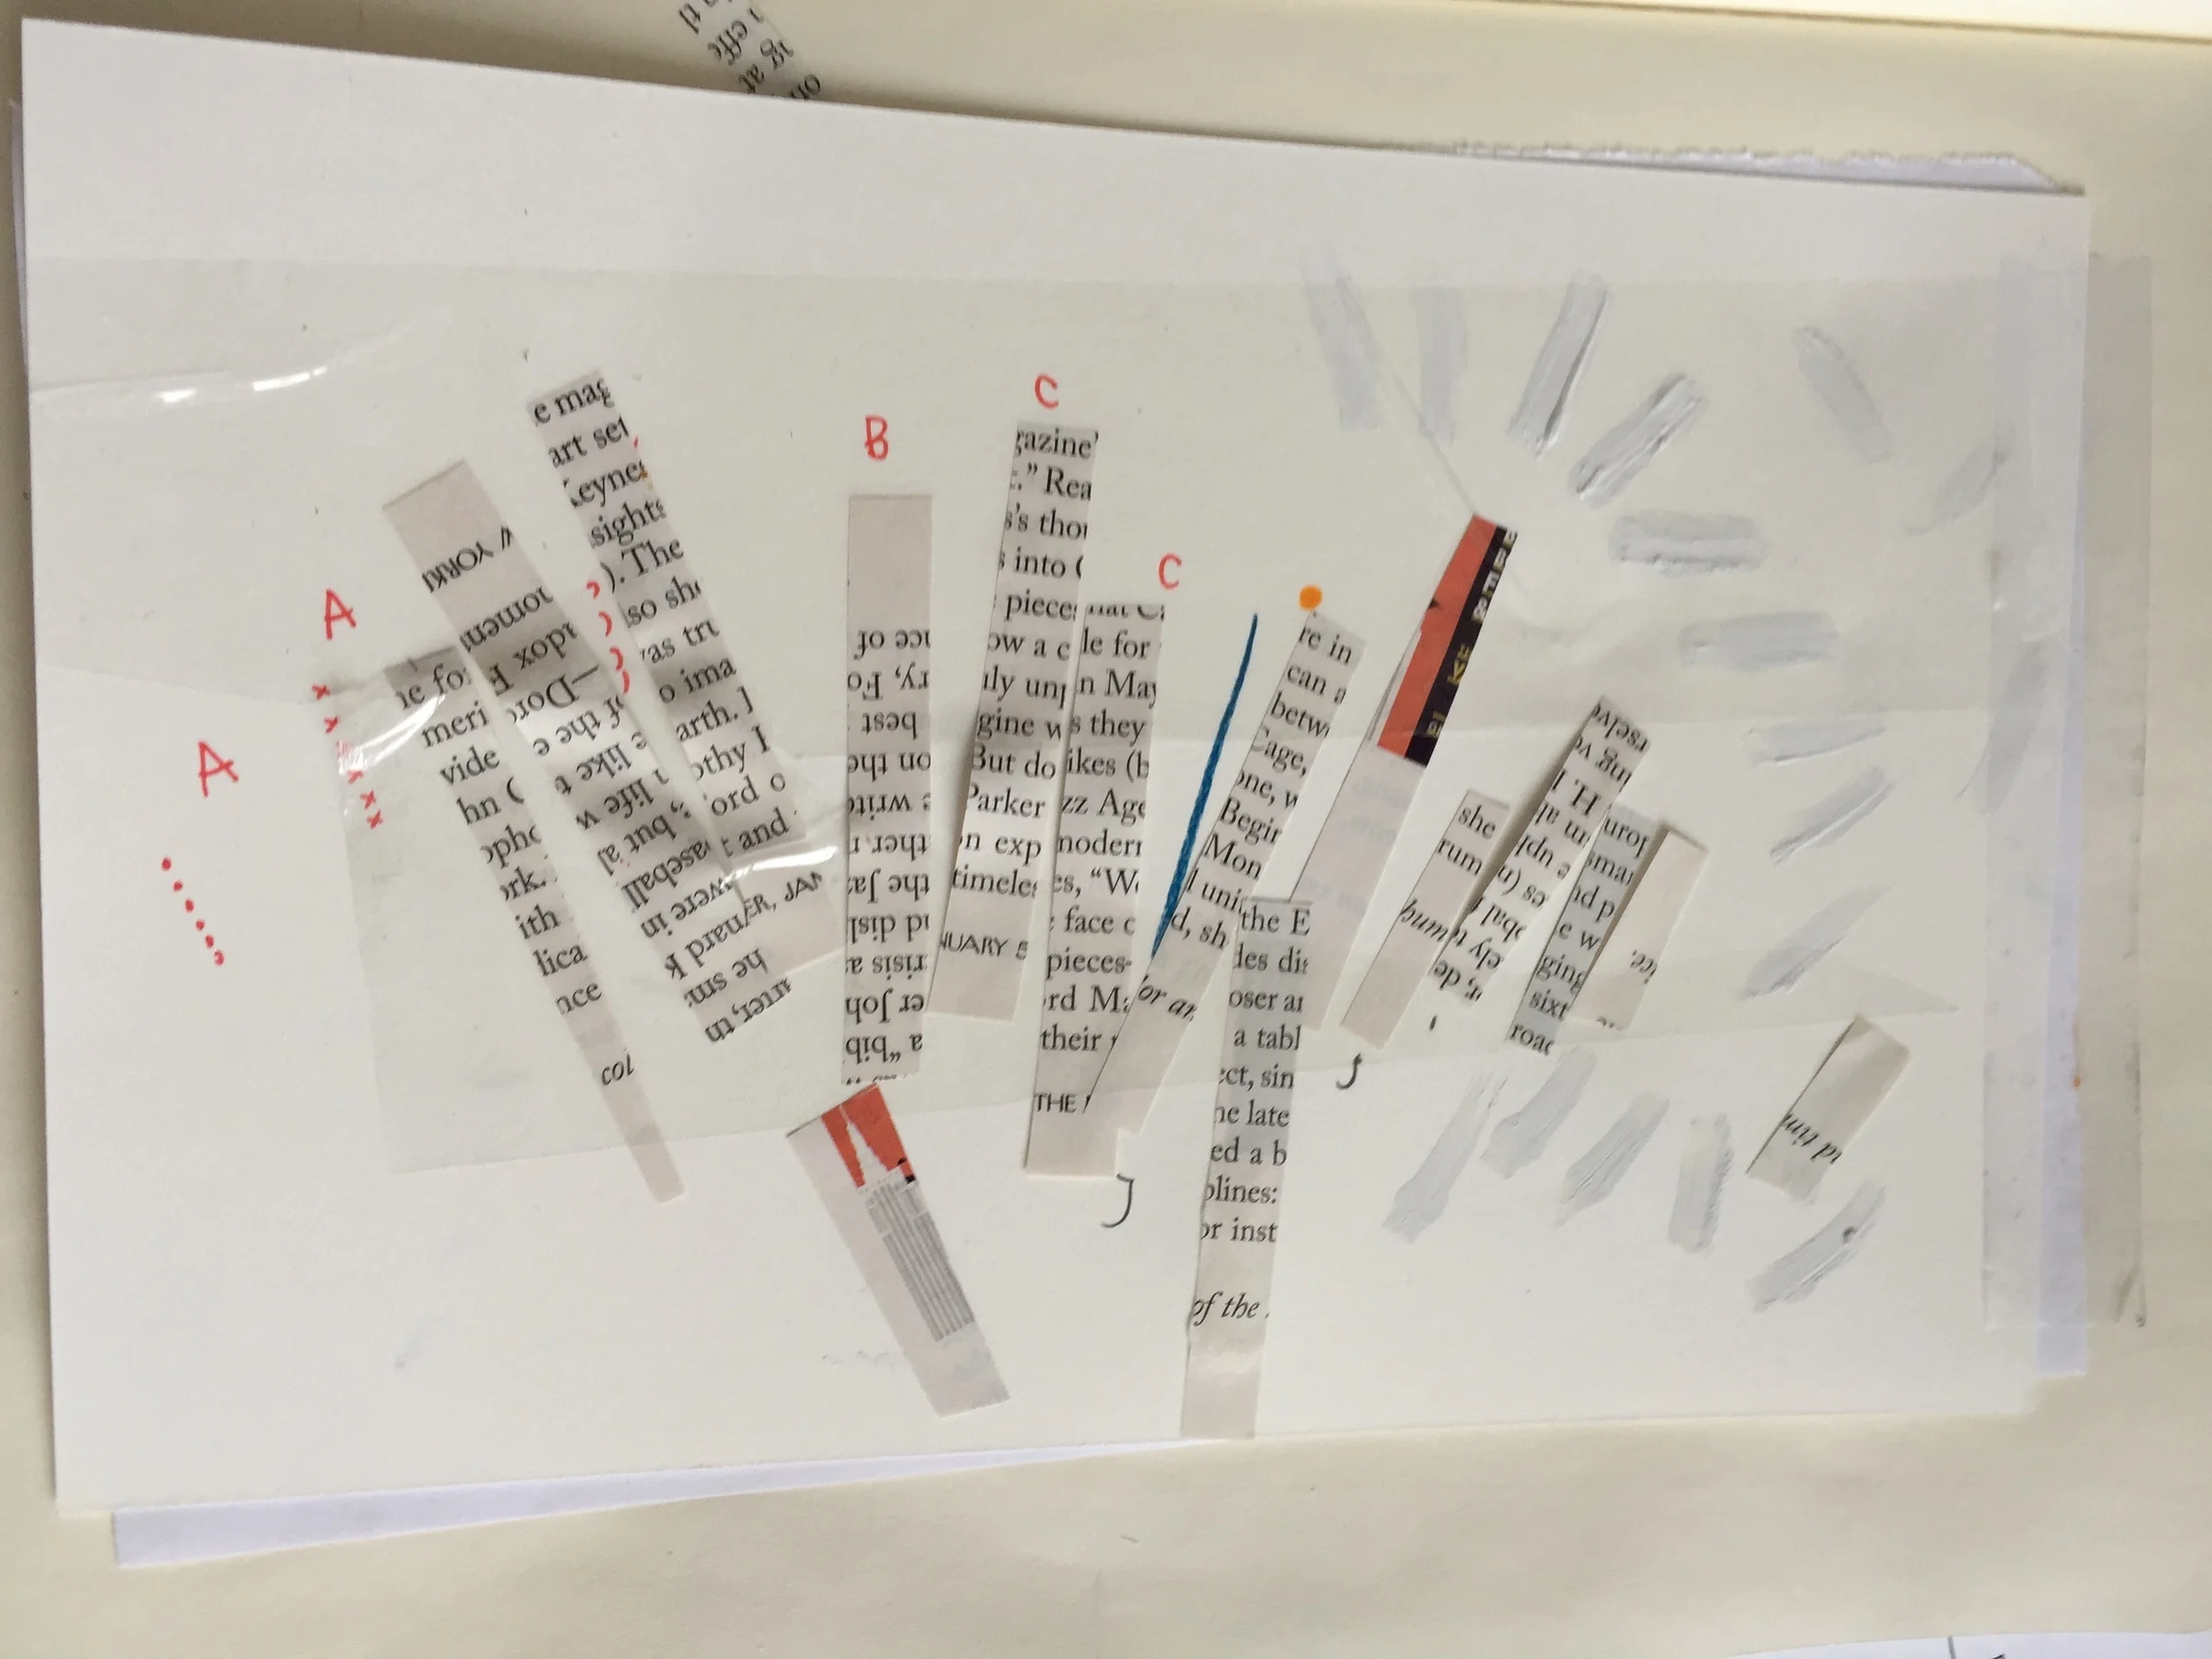
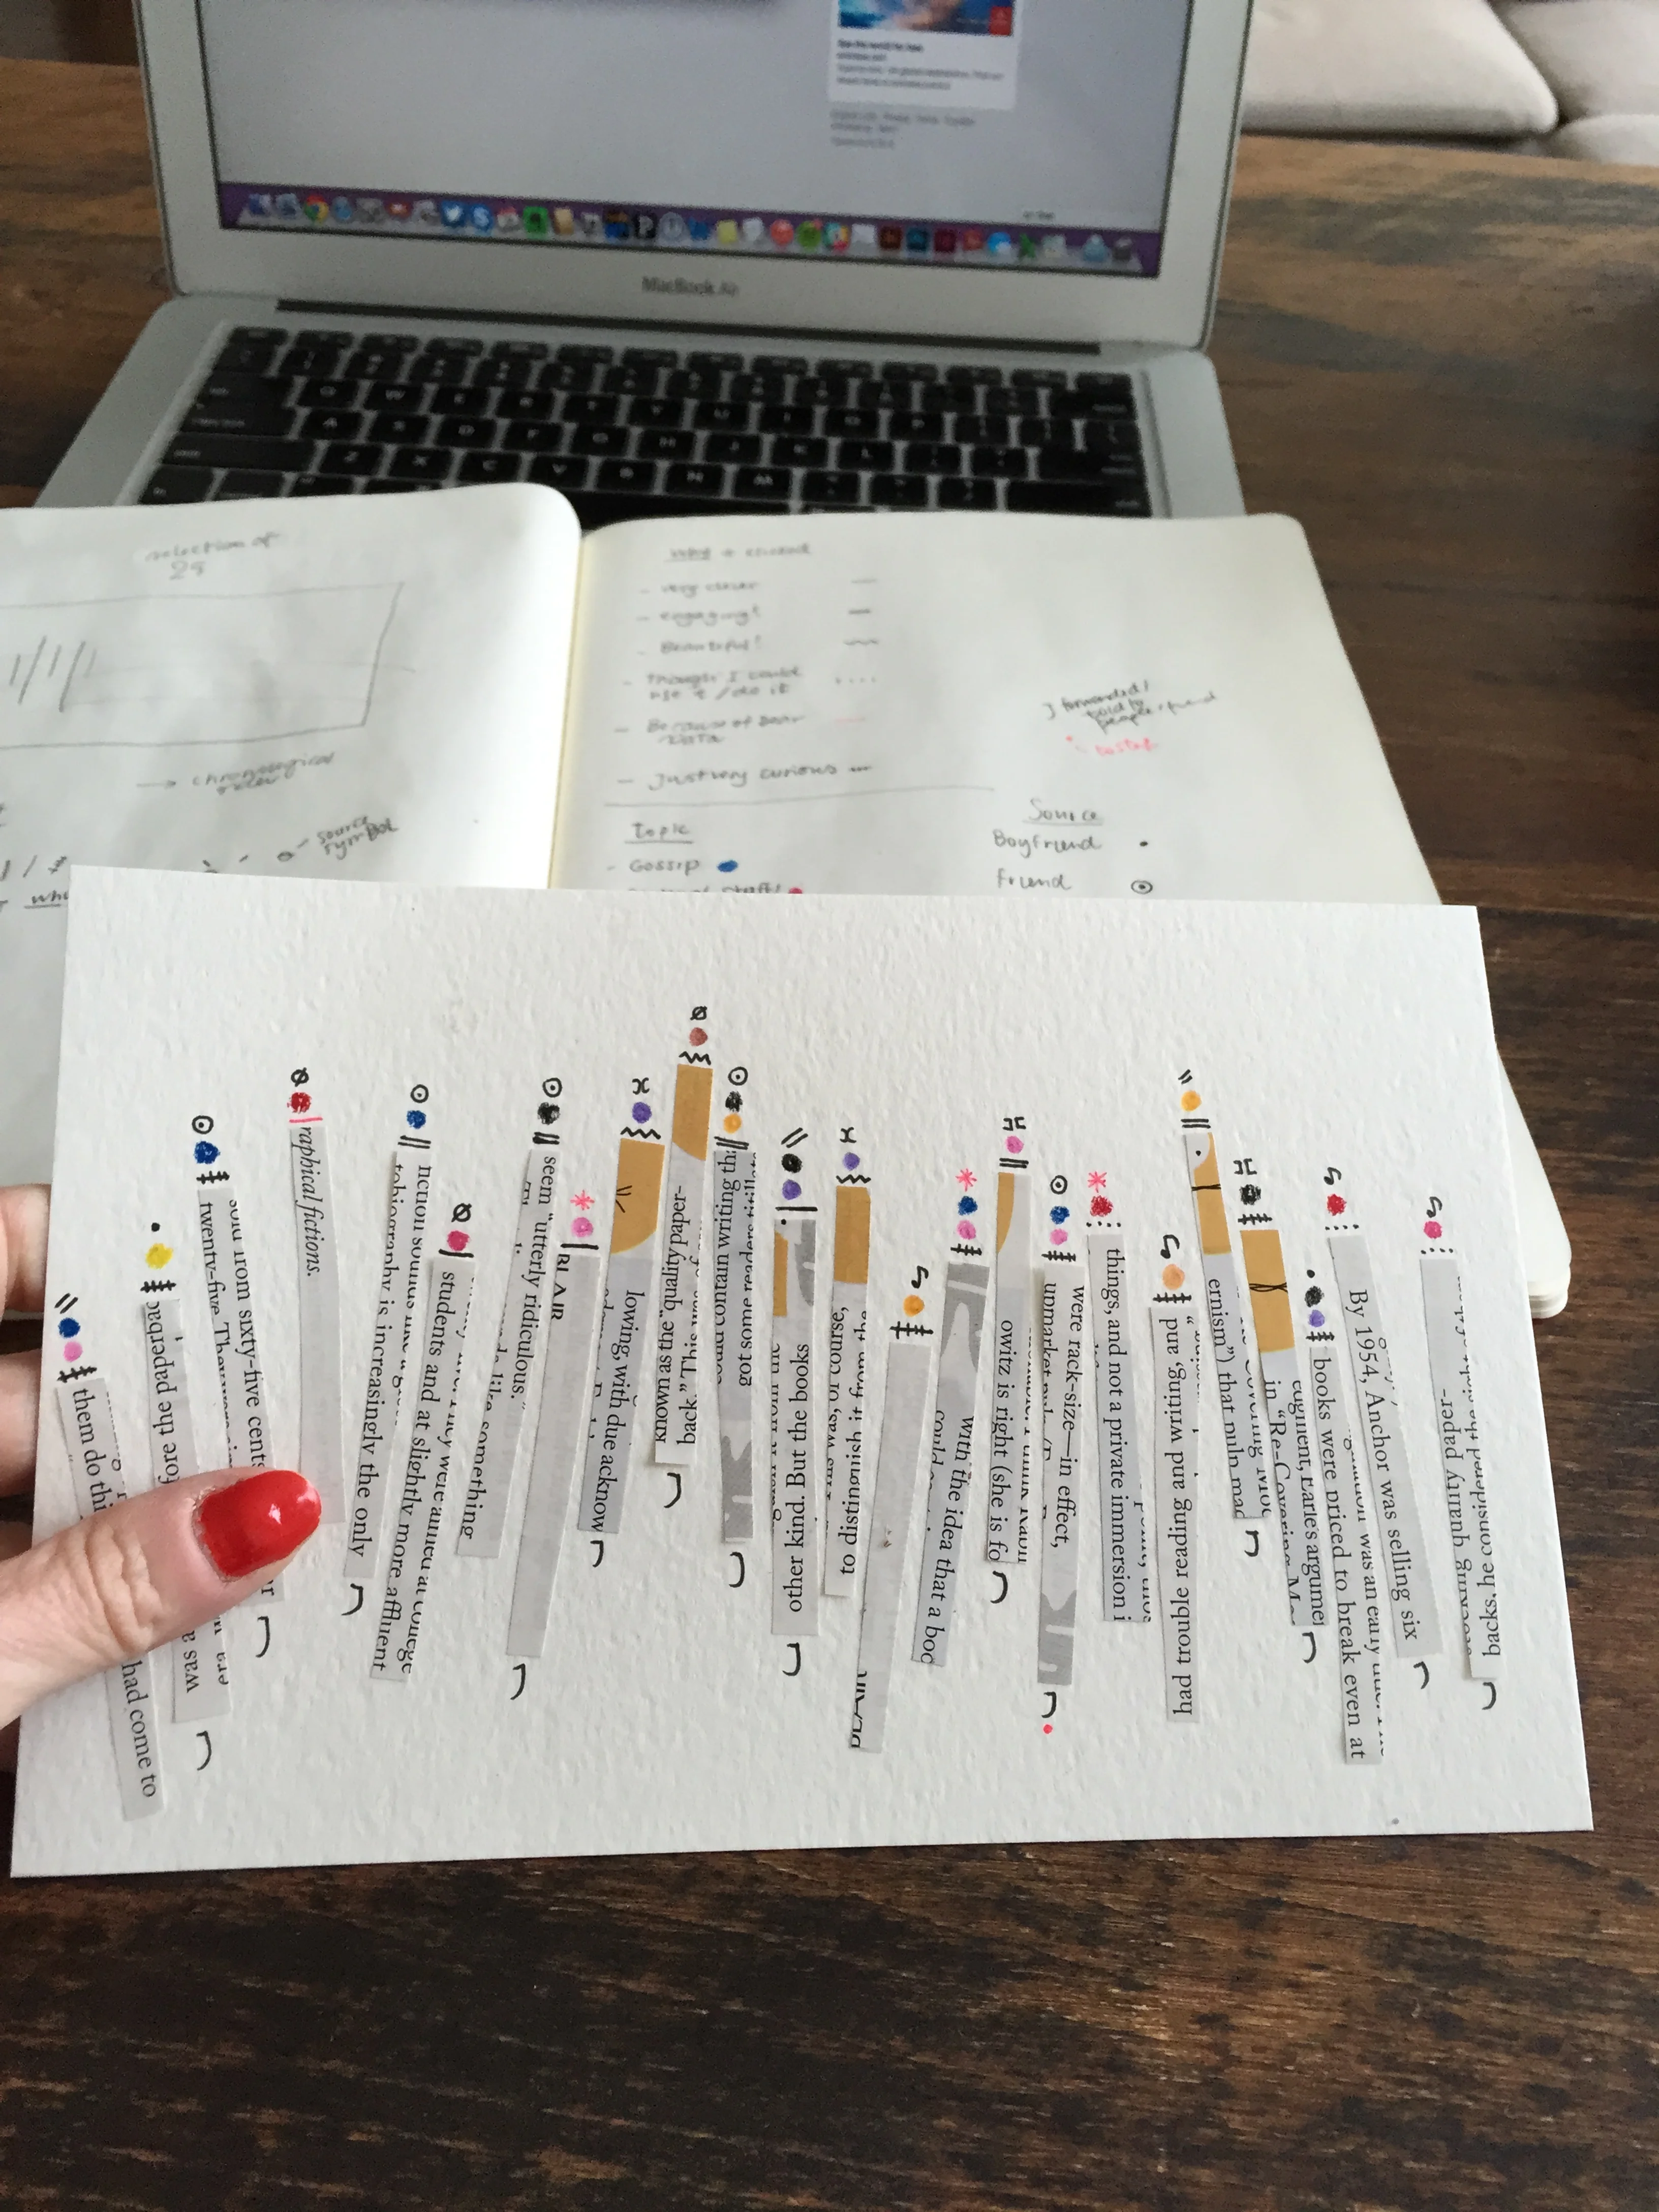
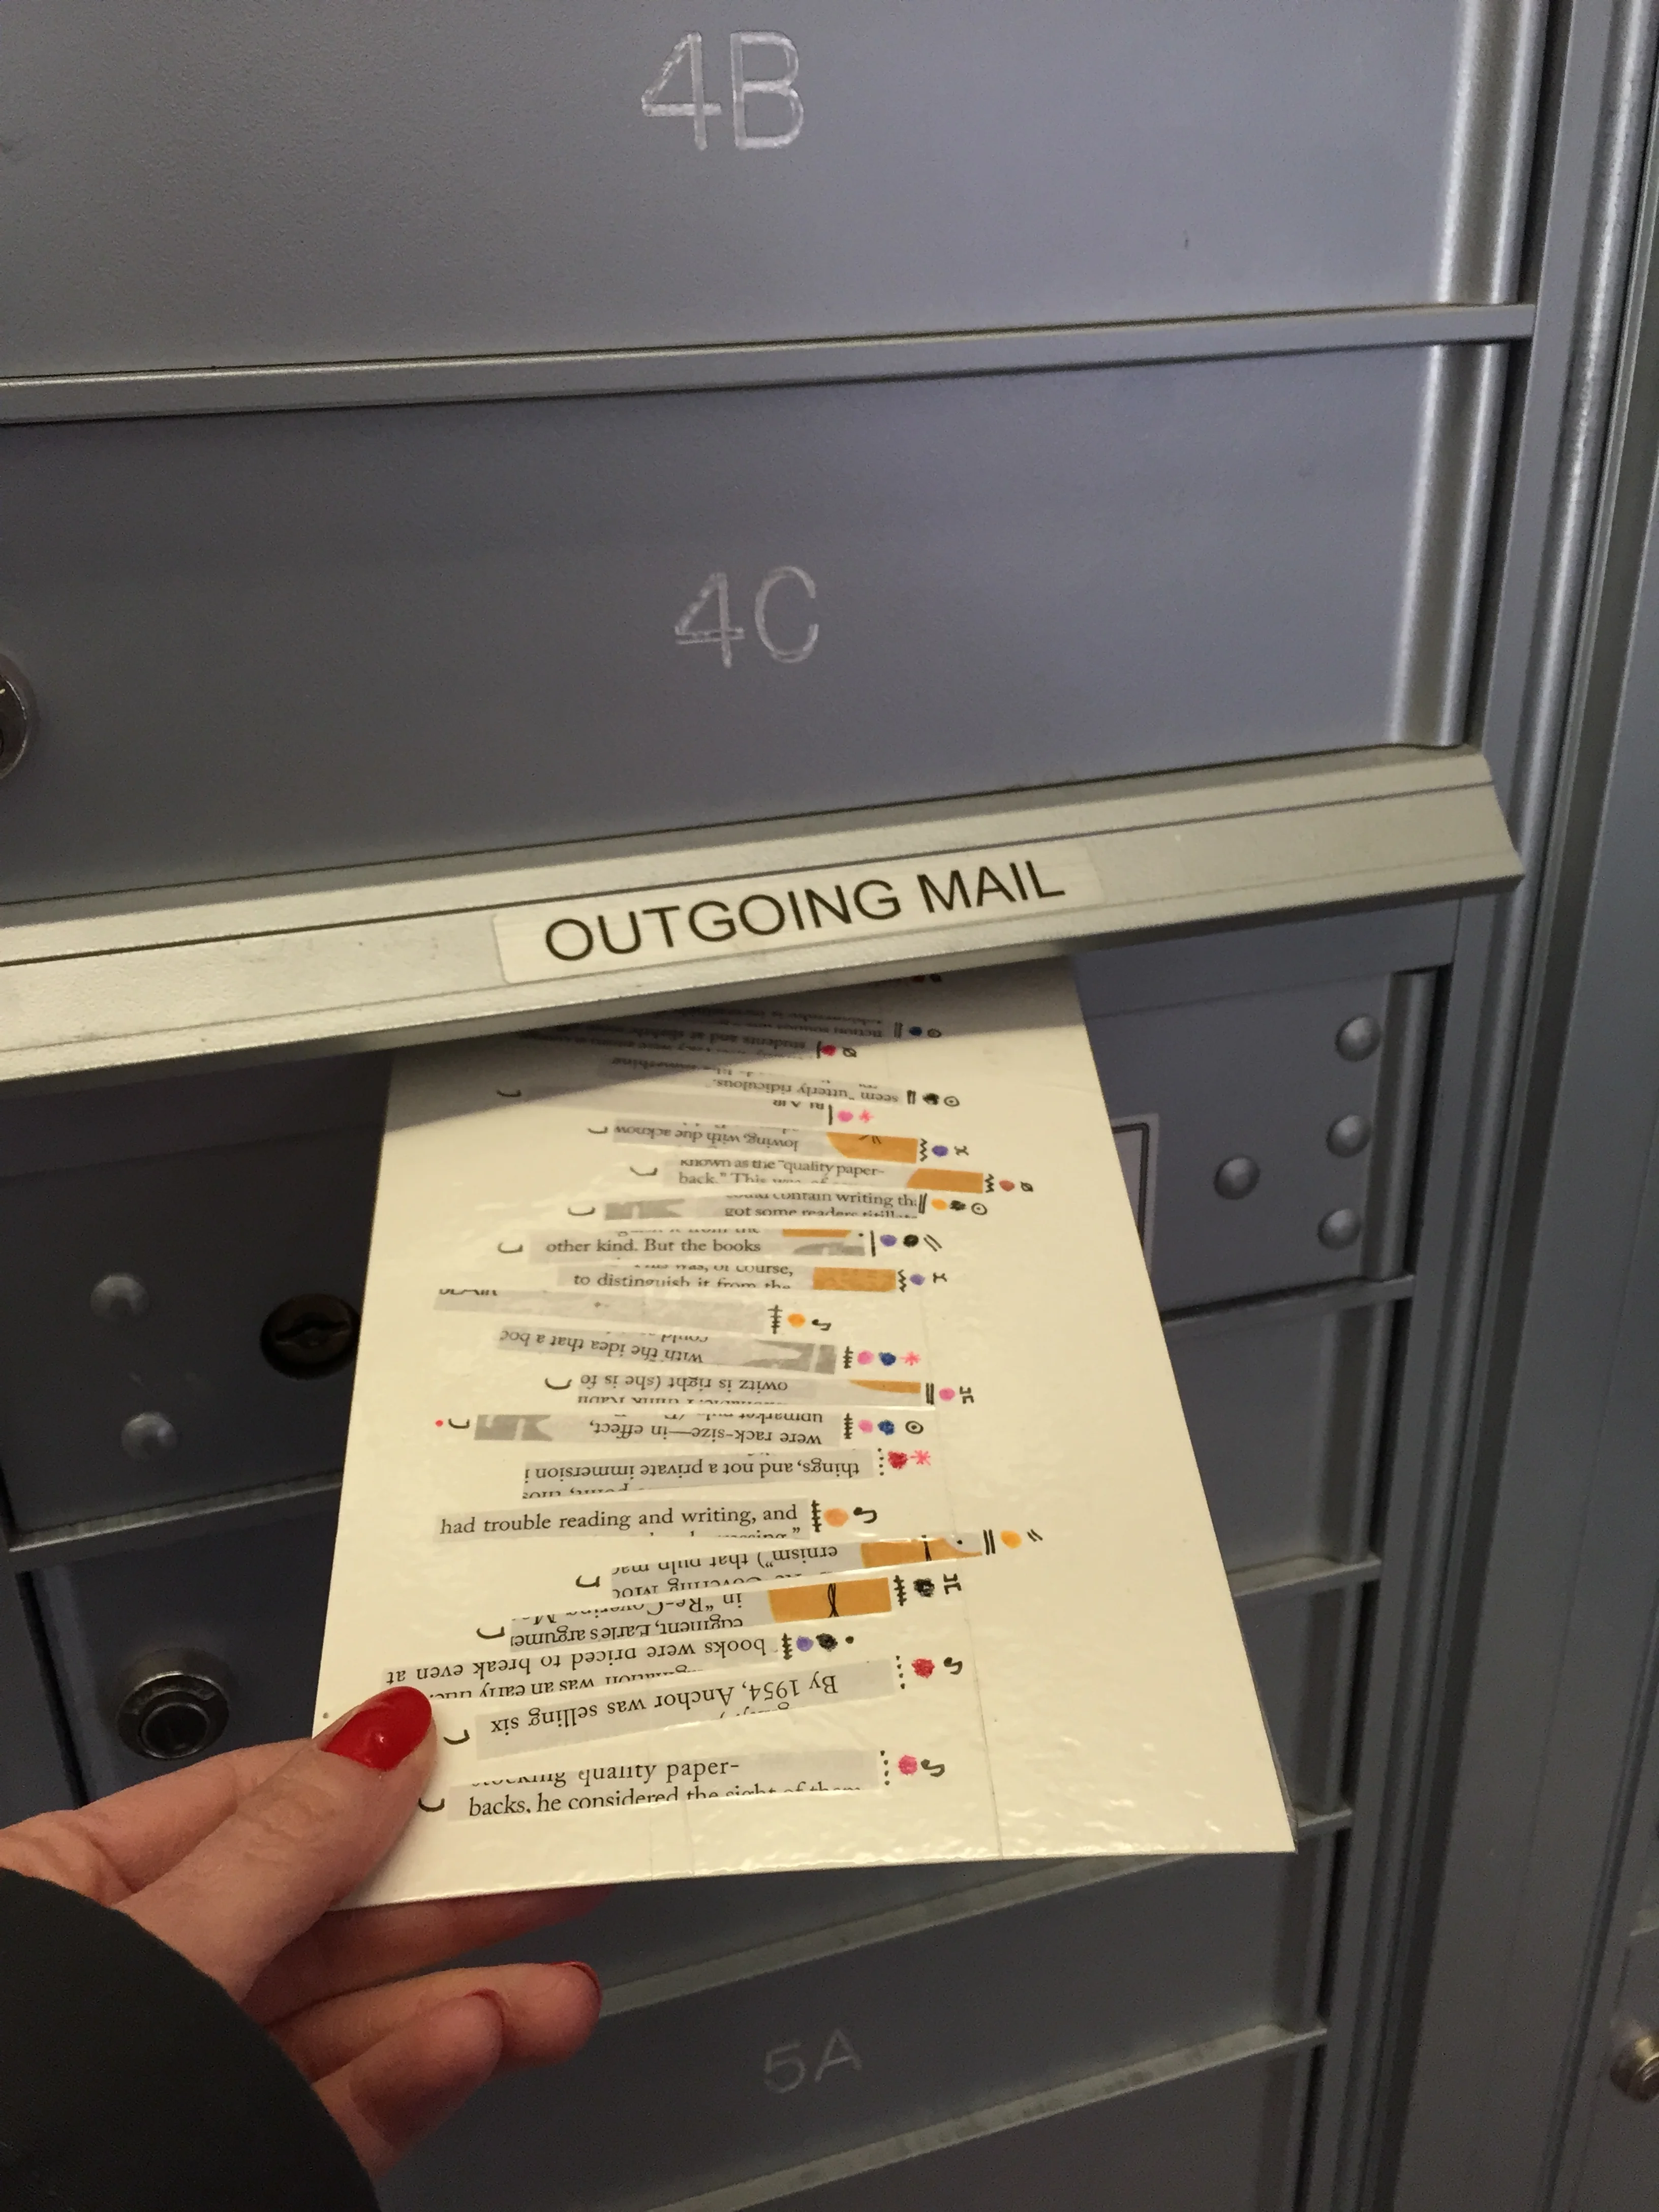
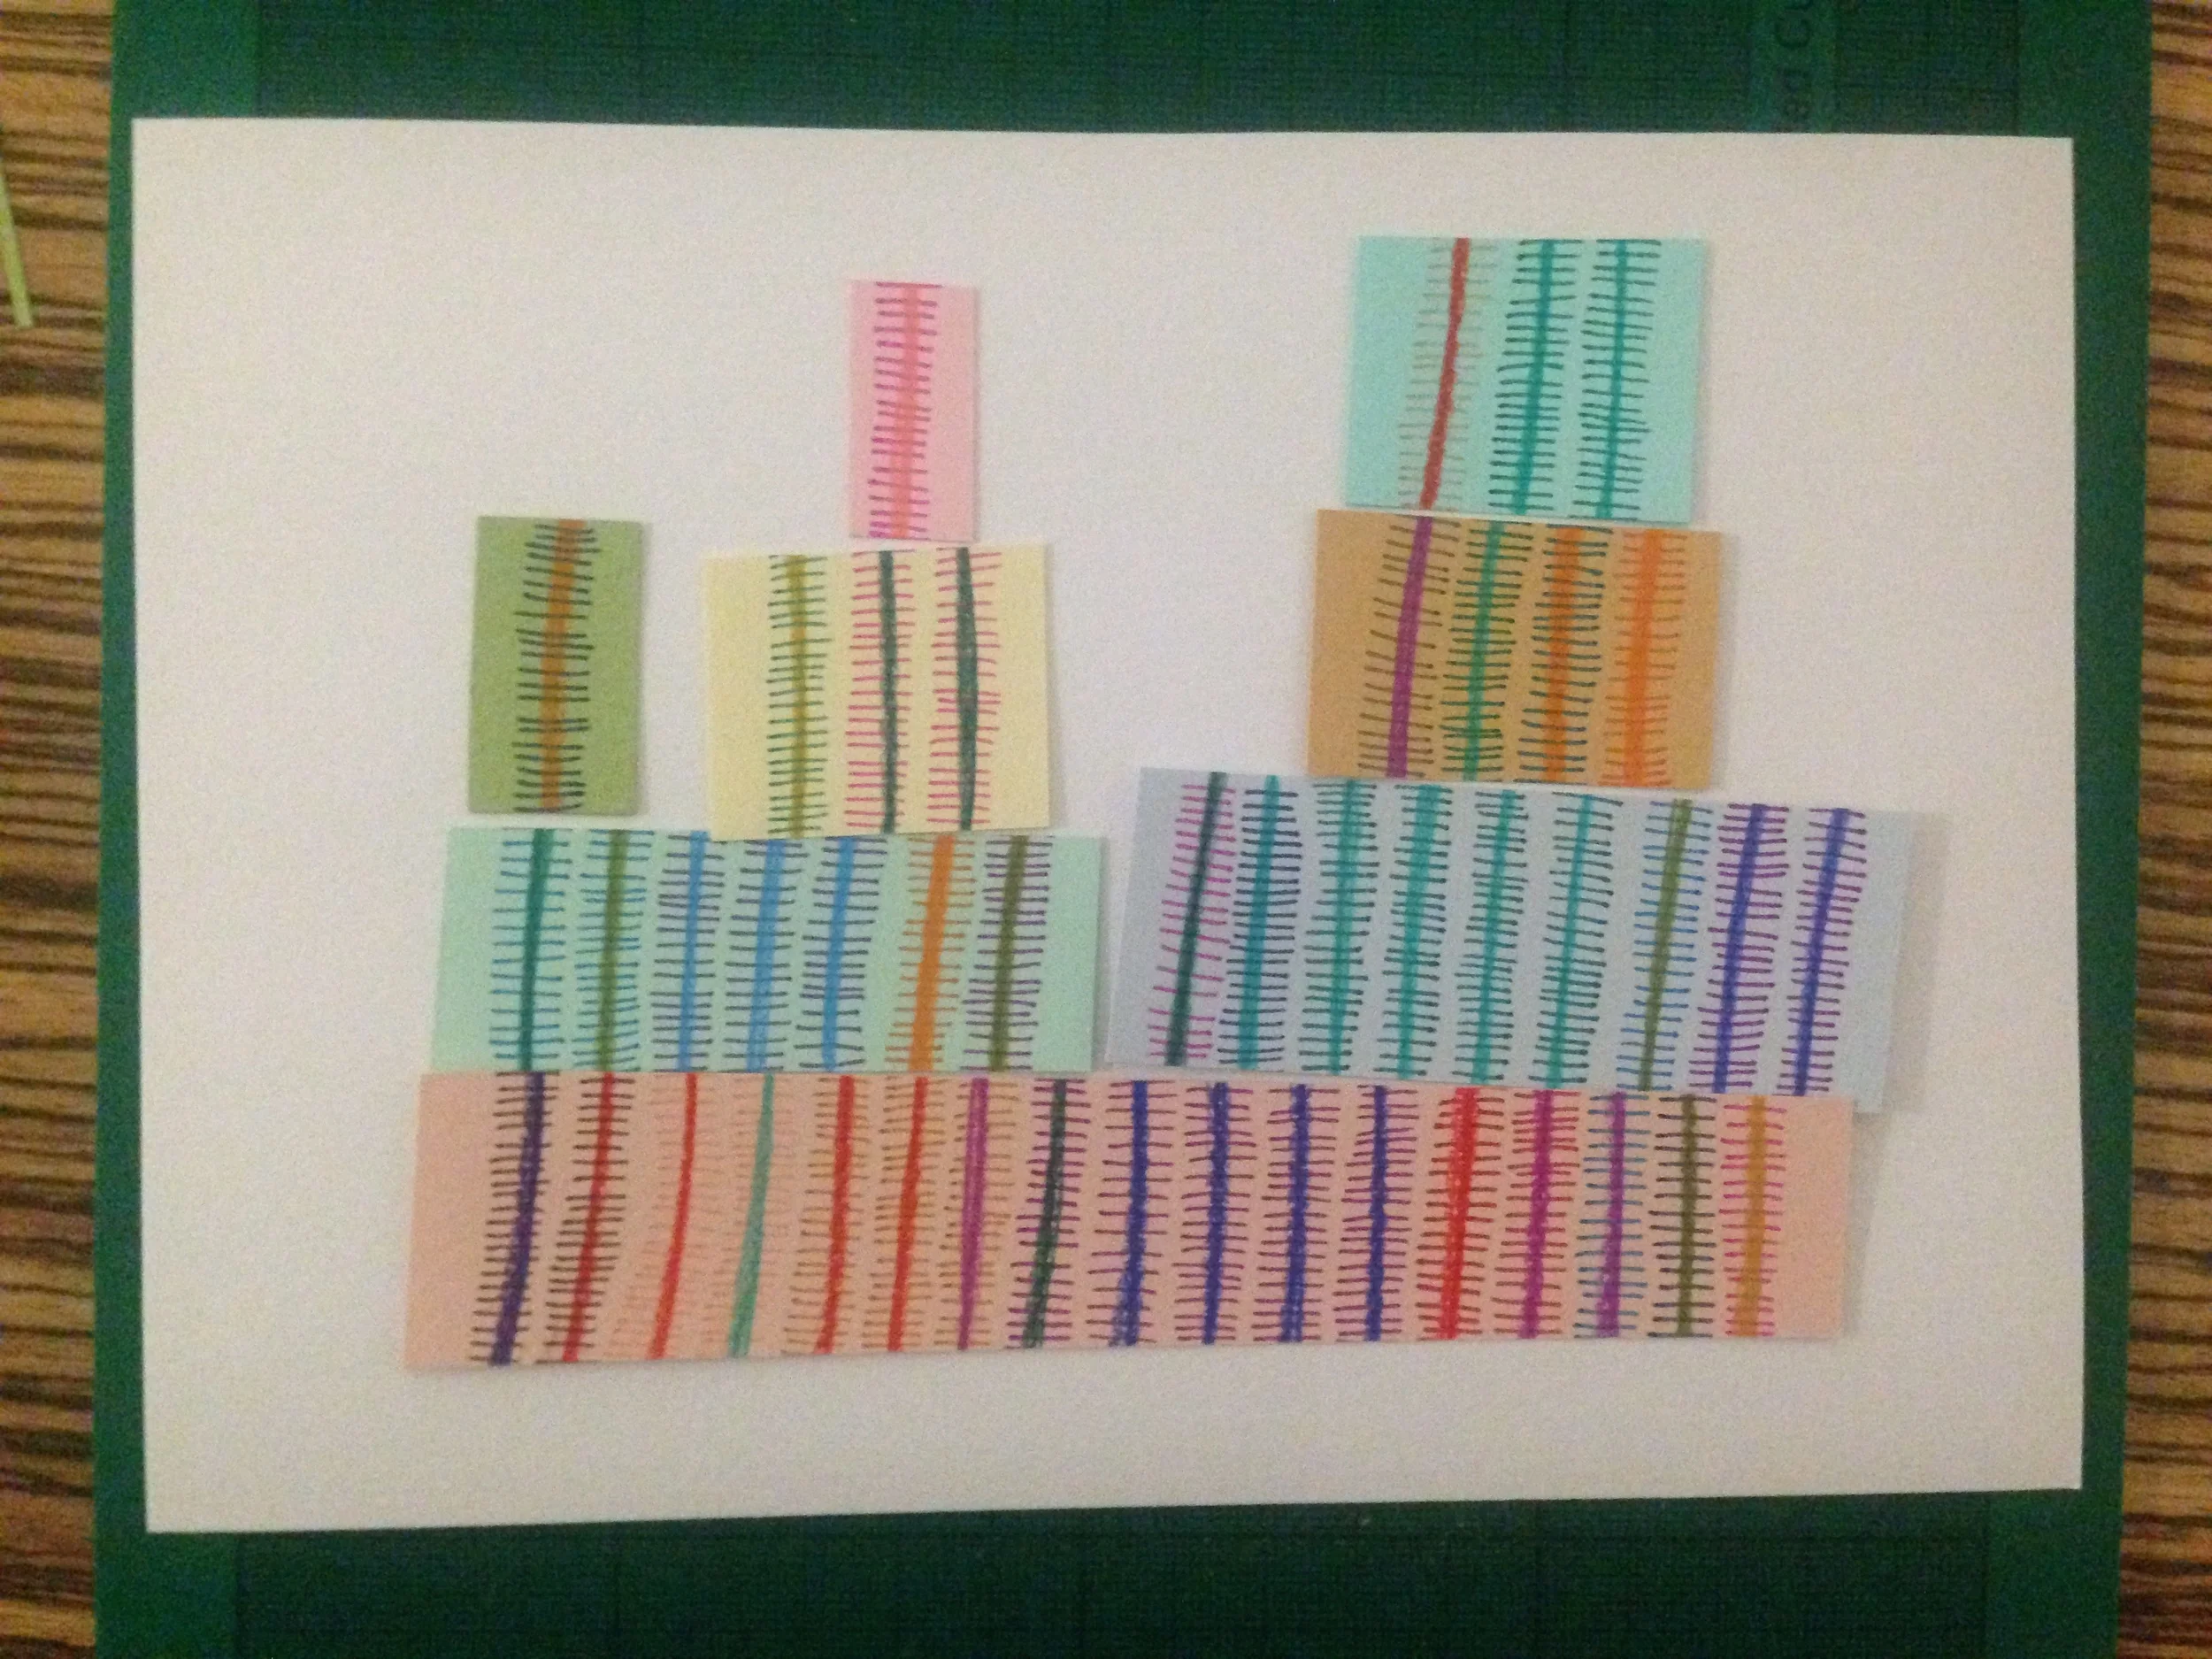
I cut a page of the New Yorker (which by the way I normally happen to buy and only read the 20% of) into tiny bits and I started to see how to play with them: how could they become pieces of data? Could I use their visual feature as attributes?
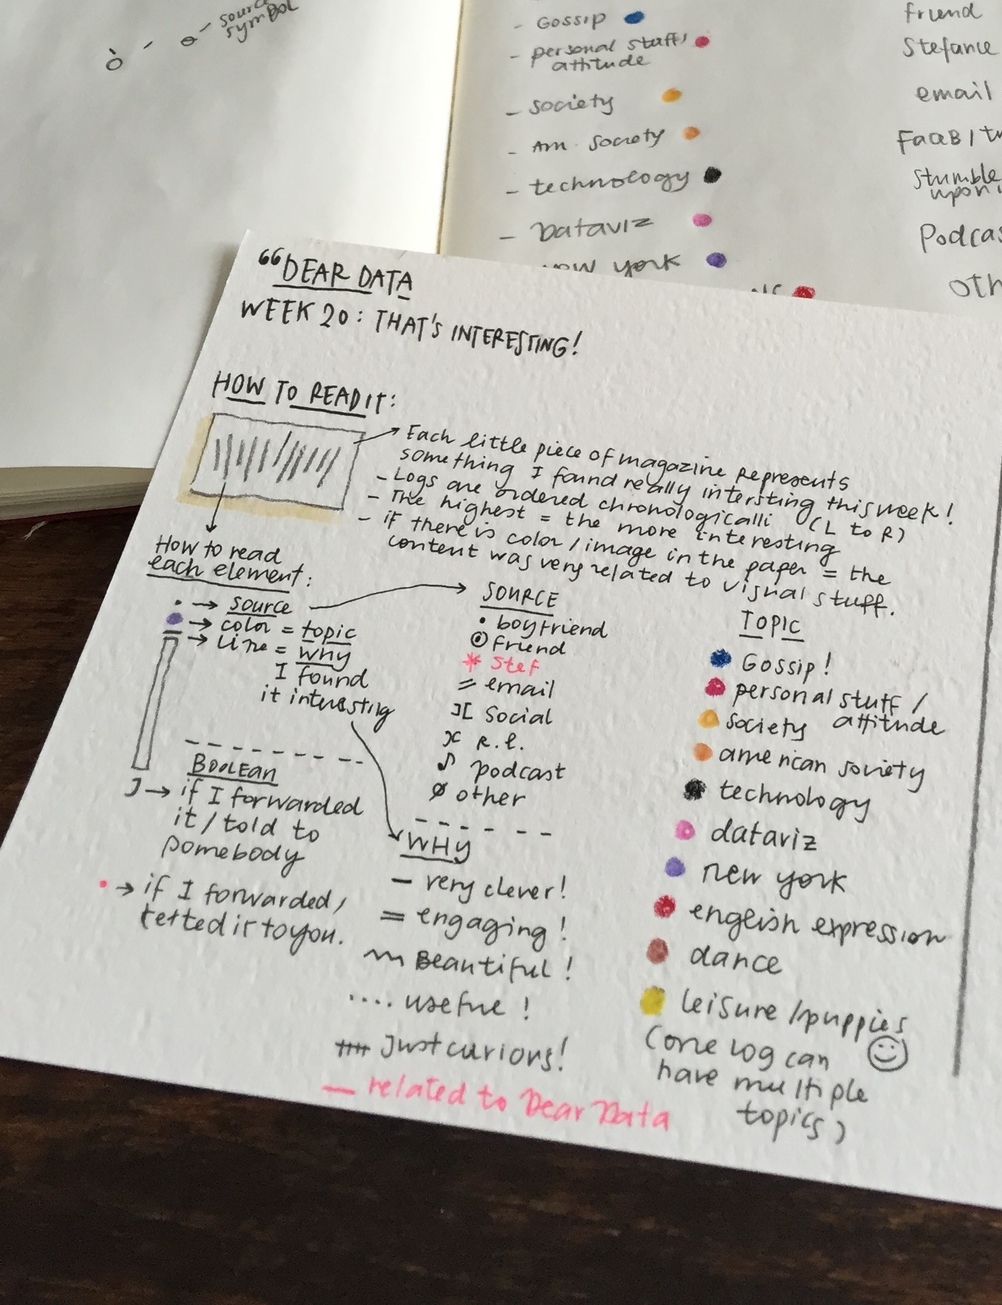
Each shred of magazine represents something I found myself deeply into during this week. I am (of course) very much attracted by visual stuff, thus I used it as a design element: if there is a color or a portion of image on the magazine’s crumb, it means the content of the article was very visual.
I ordered my relevant weekly contents in chronological order horizontally and I used the vertical dimension to display how much it absorbed me.
I then played with colors and little symbols above and below the collages to indicate the topic, the reason I found it captivating, the source, and whether I forwarded it to somebody after processing it.
I struggled a lot with those tiny pieces of thin paper and my glue, and I was about to give up with this technique at a certain point because I wasn’t able to glue them on my postcard in a perfect vertical way. So I got creative and added a little random but visible rotation to my paper fragments (forgive me dataviz critiques out there).
Stefanie’s postcard
Stefanie’s postcard is amazing: it is one of the most detailed of hers in terms of data collection. The ‘architecture’ of her postcard is build around the places she was in while she noted something interesting (clever - she didn’t only focus on her media consumption!) and the drawing seems like a nice museum’s facade to me!
I love that we both decided to categorize the topics and the reasons why we got attracted to the thing.
I am so much fascinated by how we are influencing each other on Dear Data (Stefanie, do you agree?), I would say that we are both learning more on how our minds work and we are somehow affected by that!
Dear Data findings
I am always looking forward to my Saturday mornings for Dear Data, I find it one of the highlights of my week, it is fun!
As a person I am indeed a multi-tasker, I get nervous and bored if I don only one thing at a time (for the record, I can’t even watch a movie without doing something else during it).
Drawing those postcards is absolutely not multitasking-friendly, you have to stay focused and to constantly pass from your data, to your codifications to the drawing, it’s impossible to perform any other activities while crafting your data drawing; and I find surprisingly satisfying to dedicate the proper single-tasking time for it!
A lot of people are starting to ask us how can we stay so committed to this self tracking project, and apart from the real pleasure that we find in this collaboration (ad least for me!), I also enjoy how easier it is to focus on a single little aspect of your life every week - very rigidly - instead of investigating and exploring multiple ones at the same time as I always meant to do in my past (and with no results!!).
It is a personal redevelopment: you learn to process what's going on around you, and to understand what is your perception of what's going on around you!
I definitely encourage everybody to take in some kind of self investigative project with a clear structure and defined outputs.
(Possibly with a brilliant and lovely person to collaborate with, as I am doing :D)
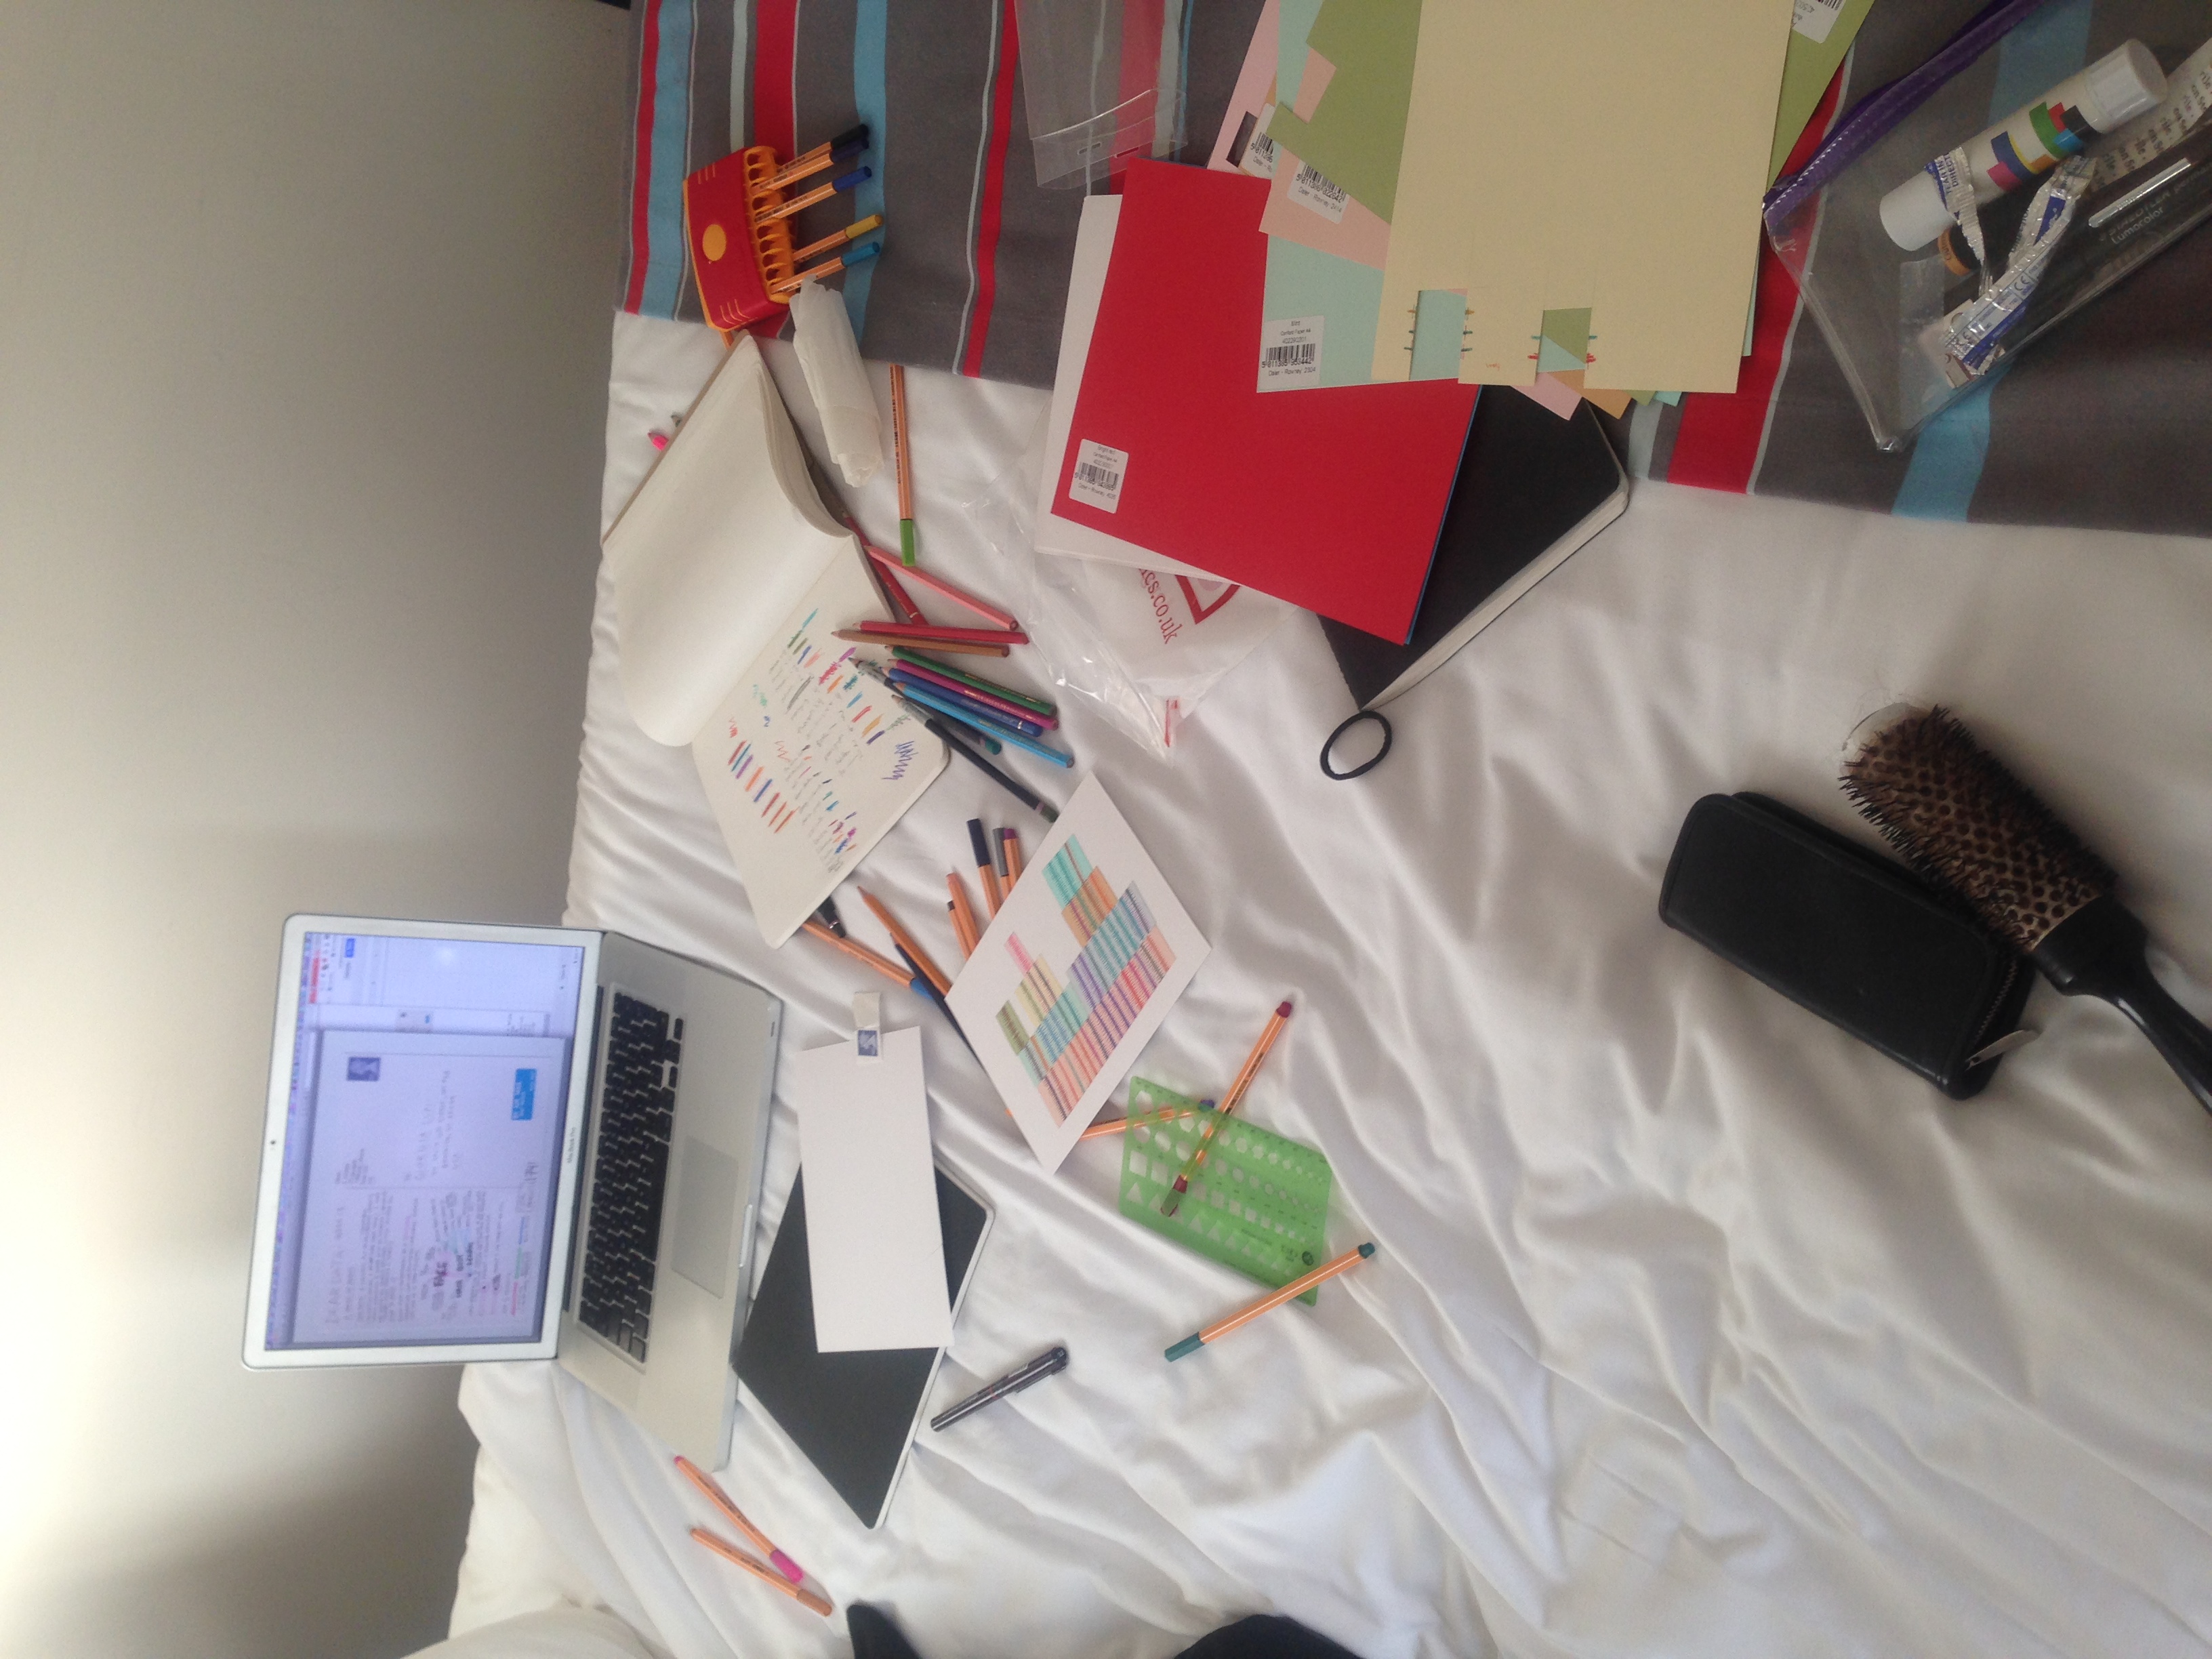
The Process:
that didn't really work...
the visual reference I chose
testing: how to fix pieces of paper?
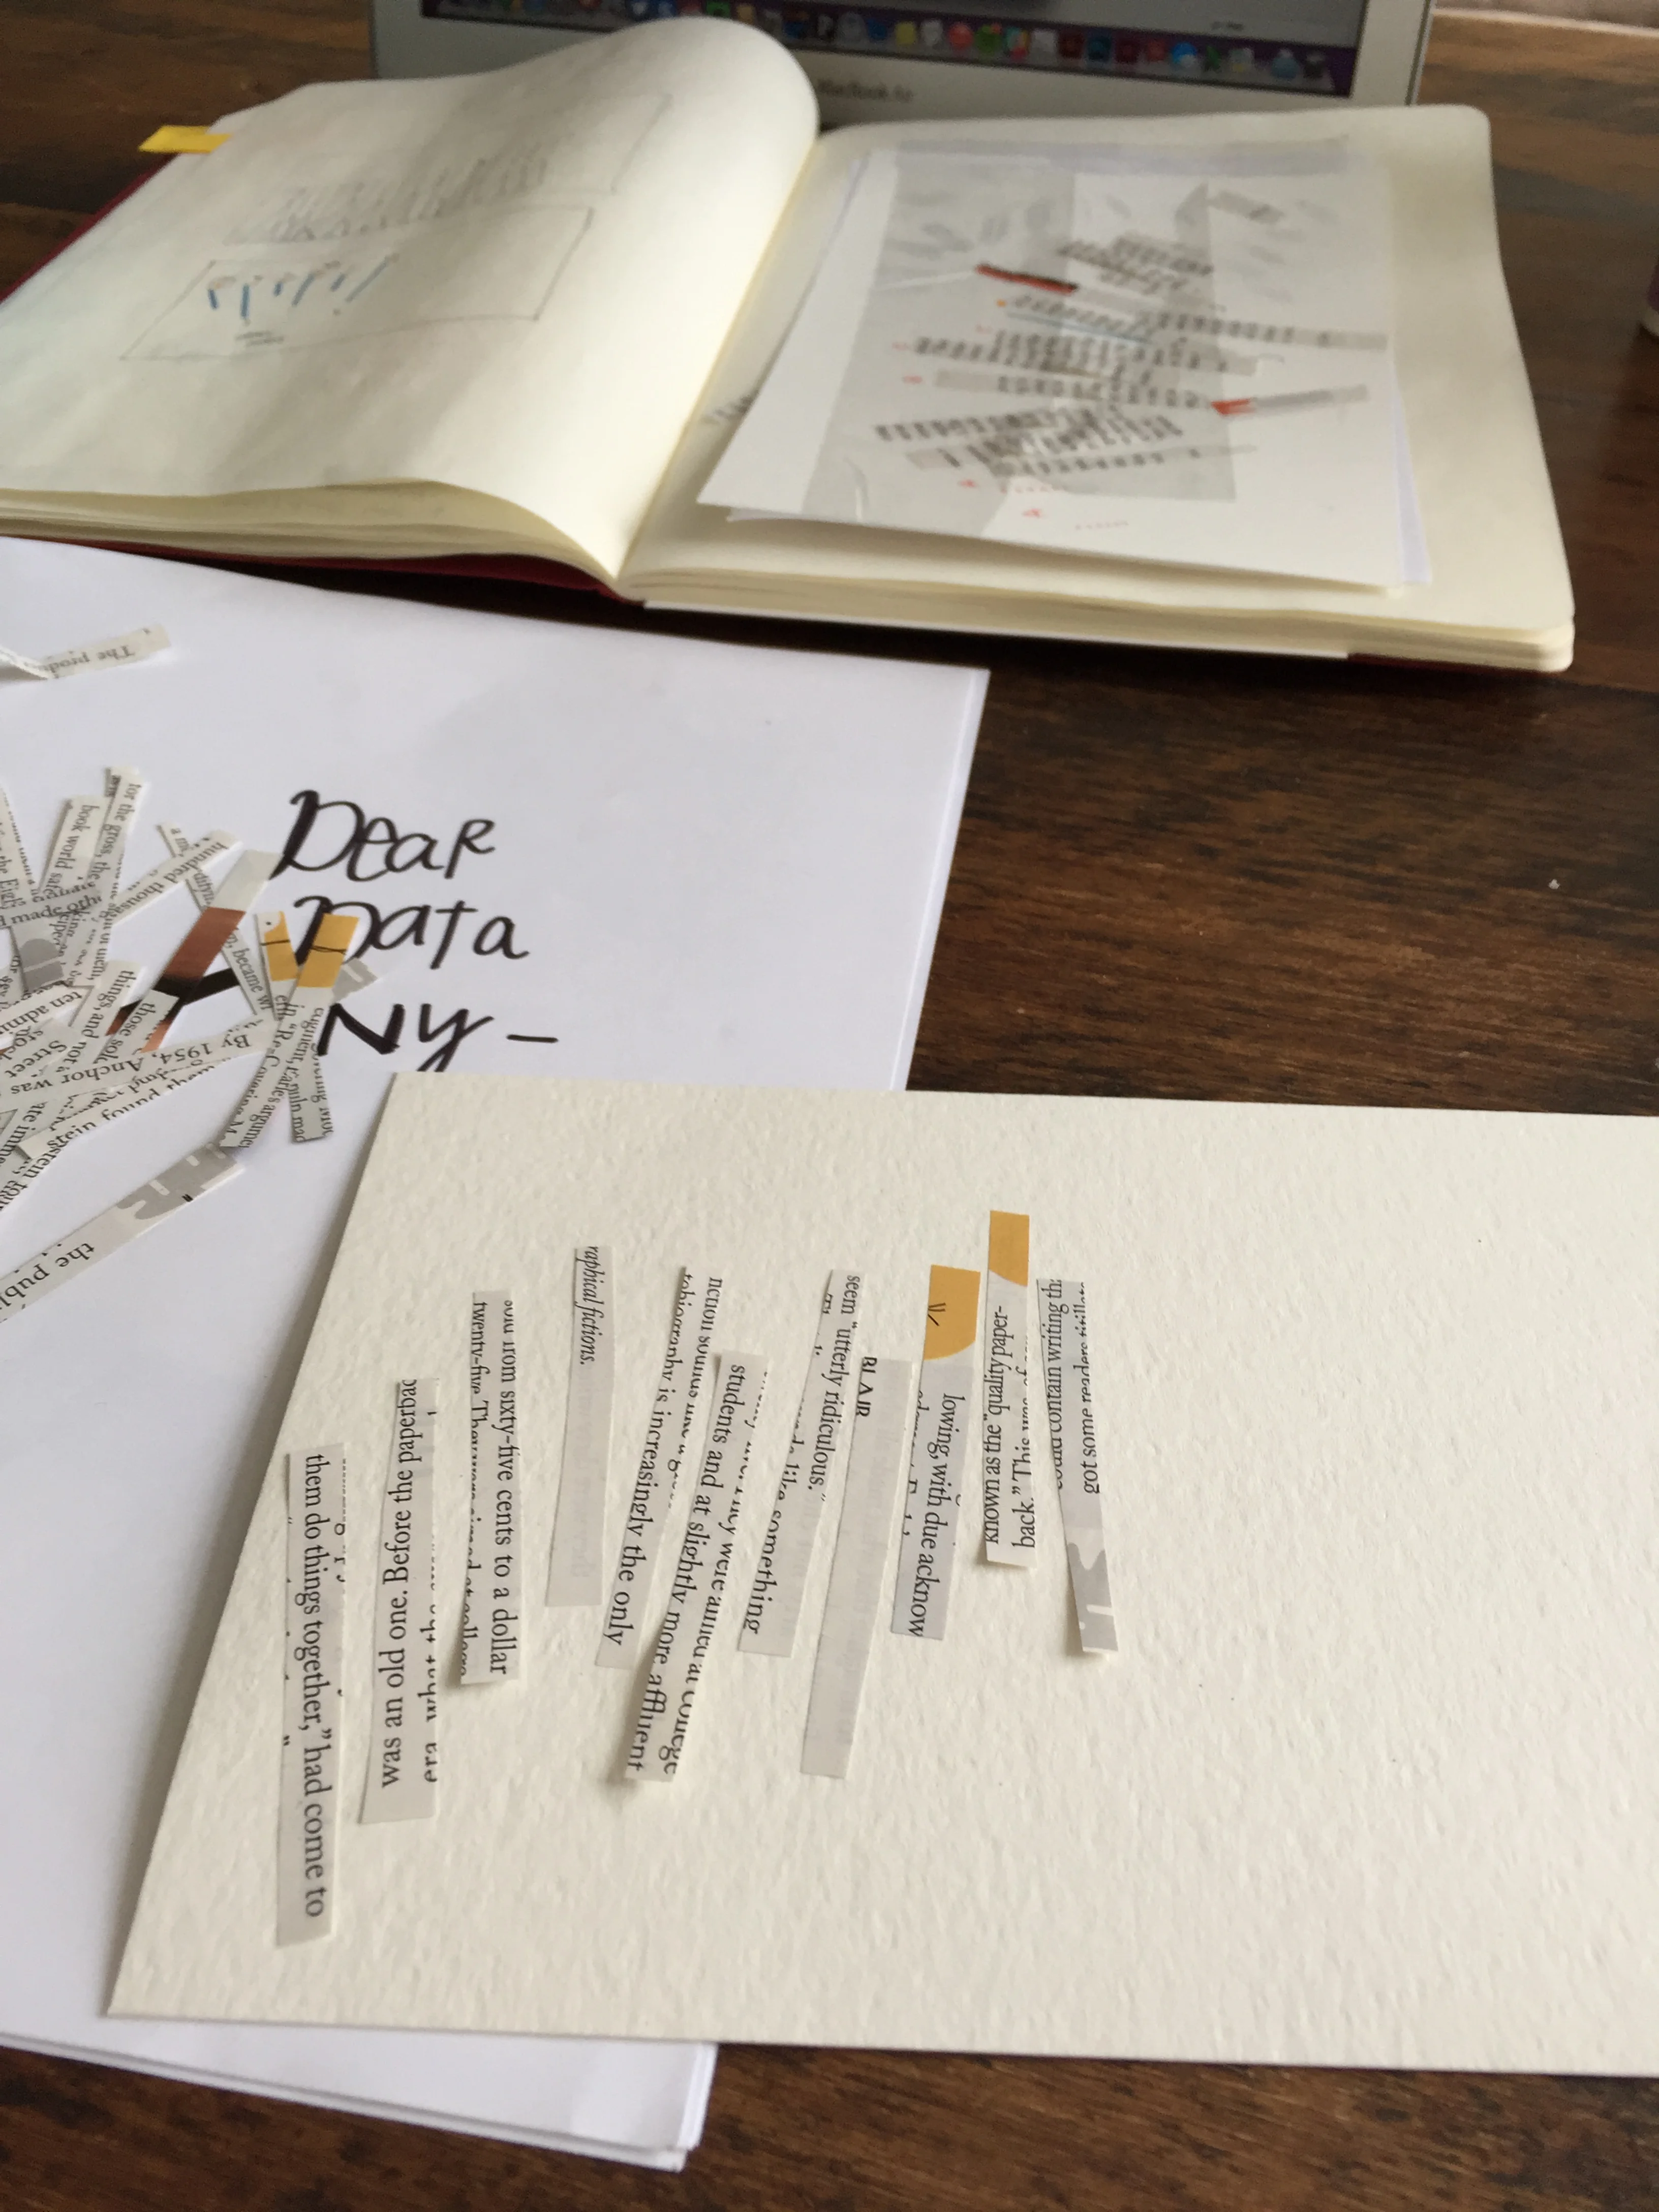
dissecting The New Yorker
done!


Stefanie
Data-gathering:
We spent the week gathering the themes or subject matter that piqued our interest. In case there were any interesting patterns, I also gathered data on the location where my interest was sparked, as well as the context of how I discovered them.
Data memories:
Not many...this is a strange week to look back on because it doesn’t feel as memorable as other weeks, as it almost almost feels like effectively a week of my browsing history, even though I’m tracking something that often happens in a physical space (and more on browsing histories in a later card). I don’t think that highlighting the location and context of my sparks of interest offered anything out of the ordinary either.
However, I think this is an example of a dataset that is more for Giorgia to gain insight into my life than for me to learn about myself through reflecting upon this data. I suppose with a project like this you can’t always have everything in every card: each week a different focus is presented, and the emphasis is either on the drawing, my personal data insights, or the data insights for Giorgia, though it’s hard to predict how the card will go until it’s drawn, really.
Data drawing:
For this week, Giorgia and I challenged each other to try using a new material/technique in our cards, and I decided to try mixing drawing with cut and collaged paper this week.
I think that I prefer the visual outcome of this card more than the content. I wouldn’t say that this card is actually very legible, to be honest, as it’s hard to tell the different coloured pencils and inks apart when set on top of the coloured paper, though I’d like to experiment with this more. Still: this is one of my favourite drawings regardless.
This card was drawn slightly belatedly on an early Monday morning in a hotel room, as you can see from the photos below. I was staying in a hotel in Cambridge, as I was taking part in an artist's lab at a university for a week.
However, when I went to the university where the lab was taking place, I couldn't find a postbox. Instead, I had to take the card to the university mailroom and hand this card to a group of mailroom staff and ask them to post it.
Now, I would have taken a photo of this event, but as I walked away, I felt a little embarrassed and silly while wondering what the mailroom staff thought after I left and they looked down at this strange postcard in their hands. Would they think that I was crazy, or weird? I can imagine that looking at a postcard like this without knowing the context would be quite a baffling experience.
This interaction was also a reminder of the fact that even though it feels like no one sees my postcard but Giorgia, this card travels through people’s hands and mailbags in order to reach its destination. People are involved in every aspect of the journey, even though it feels like a private experiment between two friends (though of course, this definitely isn't the case now that we are publishing online).
Sometimes I forget that I’ve agreed to share my data not only with Giorgia but with a wider audience who will know my thoughts, my drinking habits, my beauty products, my relationship with my husband, and so on. I’m giving up my data to the world, and while I don’t mind, it sometimes feels uncomfortable. Note that I don’t feel the same way about other types of data that I give to companies, which is interesting: I’ll happily give loads of data without realising it, yet the deliberate act of making my data public feels strange to me.
Giorgia’s card:
I love that Giorgia highlighted gossip in her card! I should have counted that as an interest, as to be honest, I love to gossip more than I really ought to, and this would have made my dataset much more interesting, I’m sure.
I also enjoy how she is using the texture and pattern in the collaged paper to communicate meaning: I never would have thought about this, but there is something interesting in using pre-made graphic elements, pattern, and material to communicate data. It’s definitely something to explore further, so I hope Giorgia does more of this.
The Process:
Drawing on a hotel bed...
Positioning my bits of paper... (no posting photo this week, due to aforementioned embarrassment)