Week 27:
A week of media

Giorgia
The topic, and my data
This week we decided to track what we read on the media, to get to know each other’s interests.
I kept note of what I watched and listened to as well, without including fiction, TV shows and the documents or articles I needed to read for work reasons.
Some weeks, like this one, are liberating, in a way.
I never read about politics, news stories, economy, or what’s going on in the world, and this is shameful, of course,
I basically just read things that matters in my daily life...!
The topics of my readings this week were in fact:
- general on design,
- UX, UI, data visualization,
- business strategy,
- team management,
- visual perception,
- social media,
- love / dating / relationships,
- habits / daily routine,
- childfree (hem!),
- New York related things,
- personal / self improvement,
- book reviews,
- etiquettes.
I spent a good bit of my adulthood pretending I could eventually be interested in matters people normally read, but I am just not!
This is a part of myself that it is hard to share, but this particular way of sharing your weirdest habits, your flaws, …in tiny quantitative bits every week, it helps not being afraid of doing it, in a way.
The postcard:
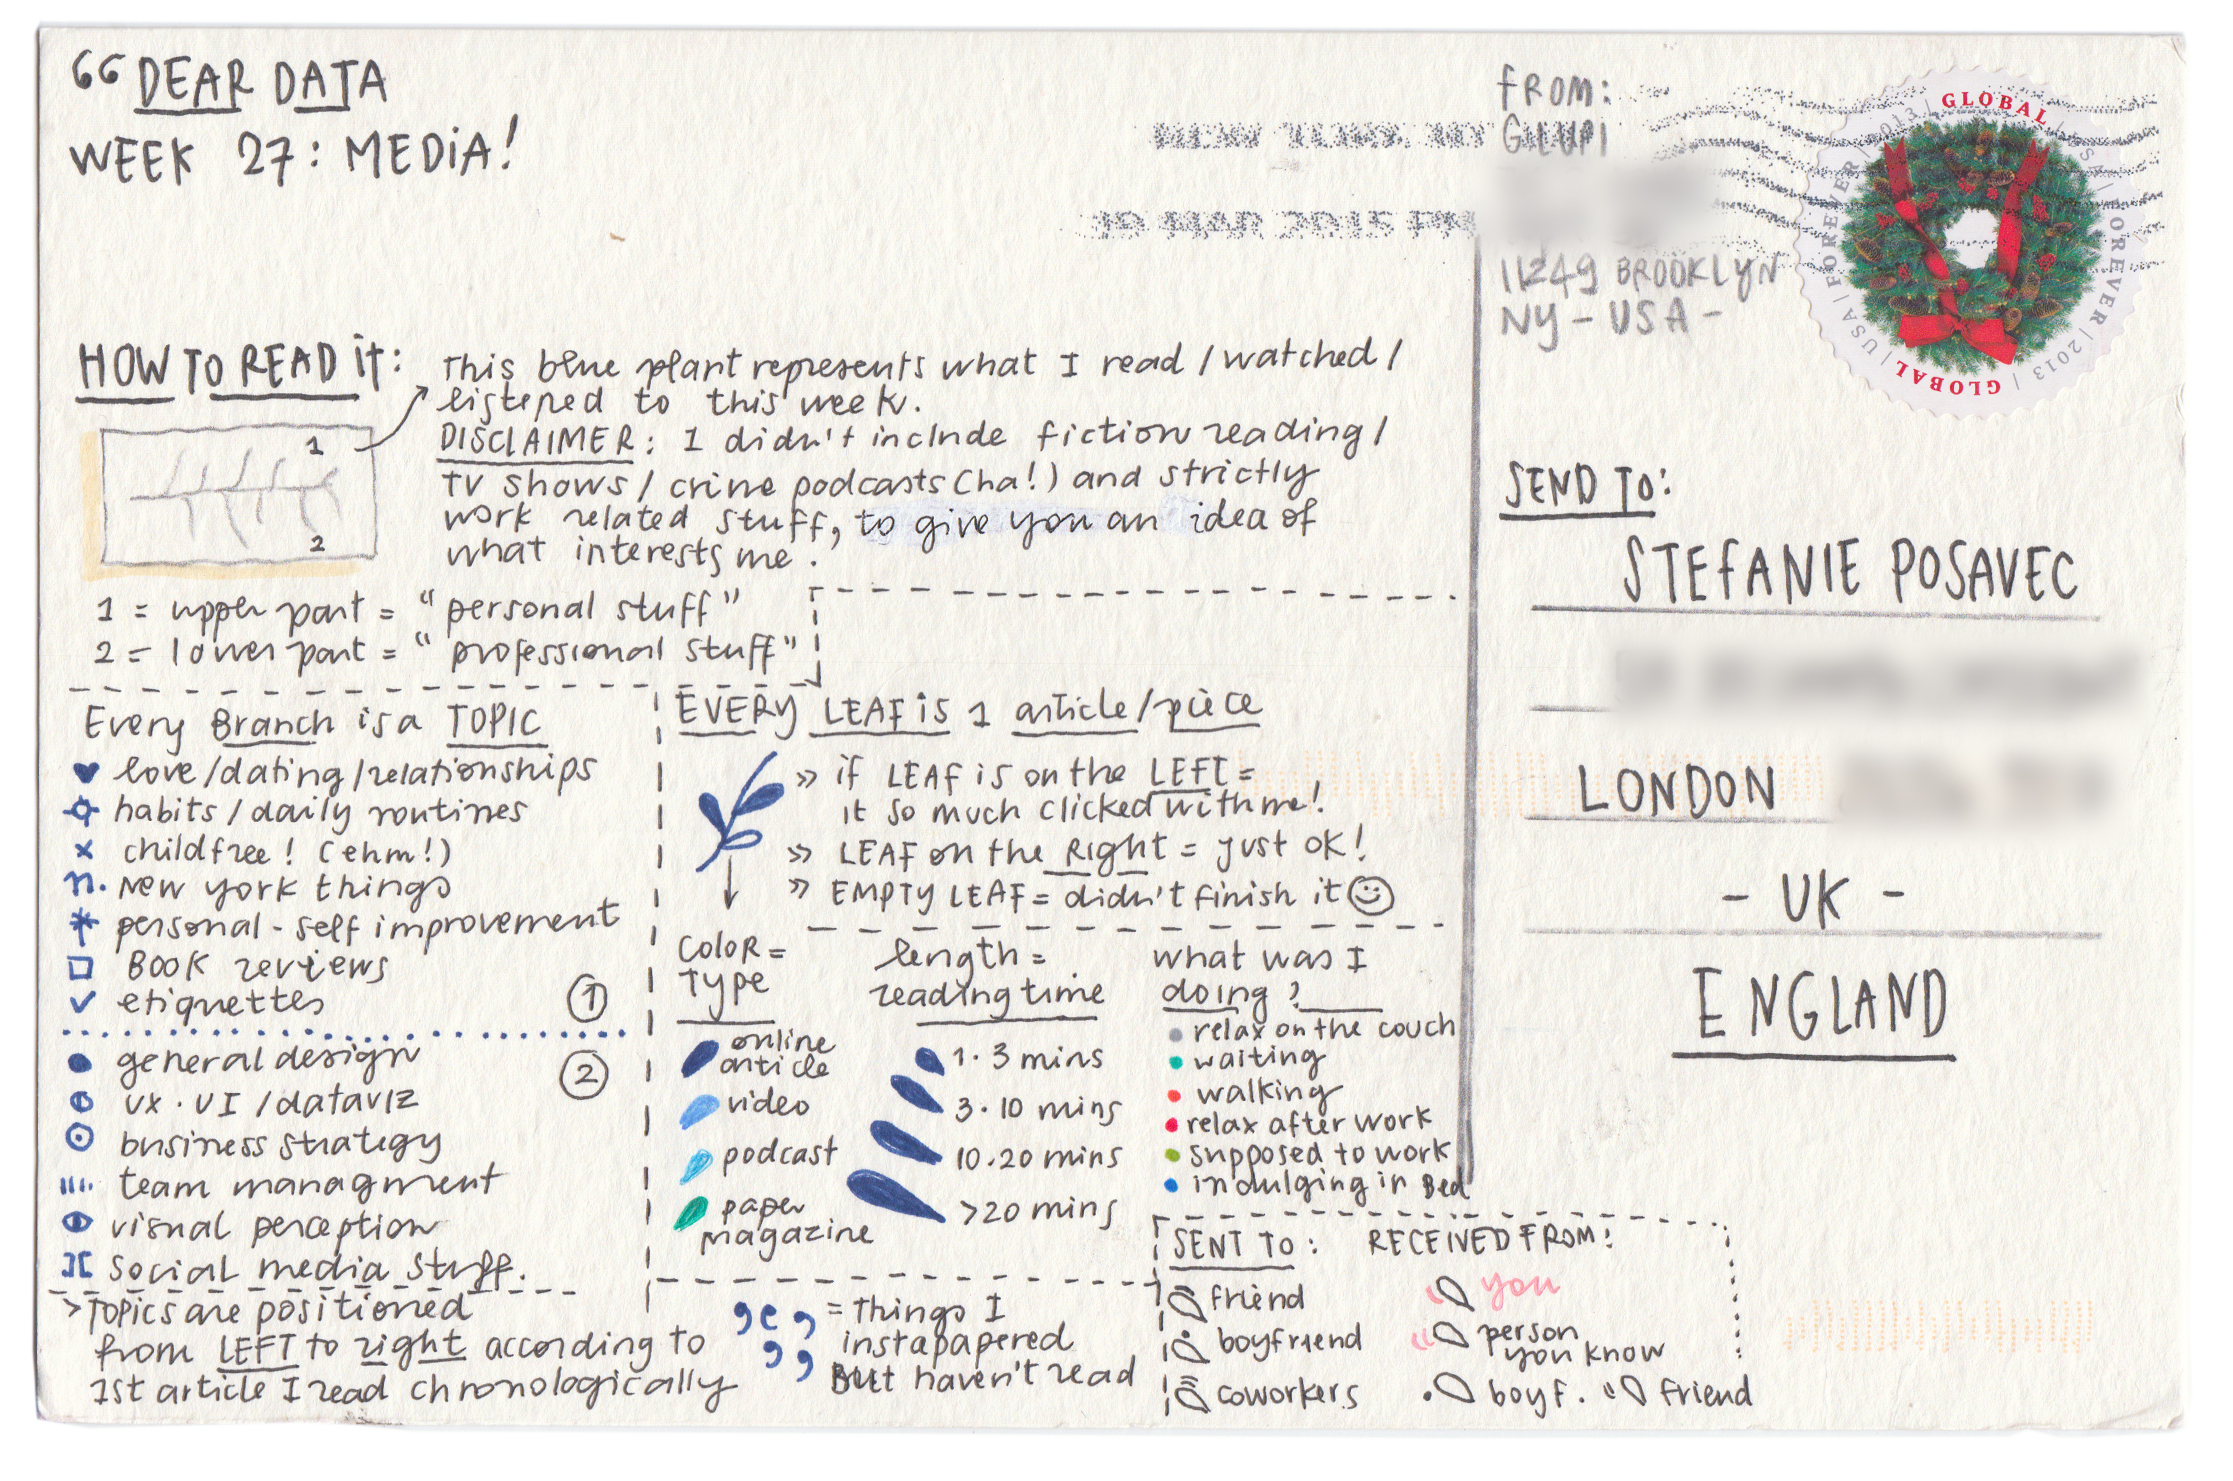
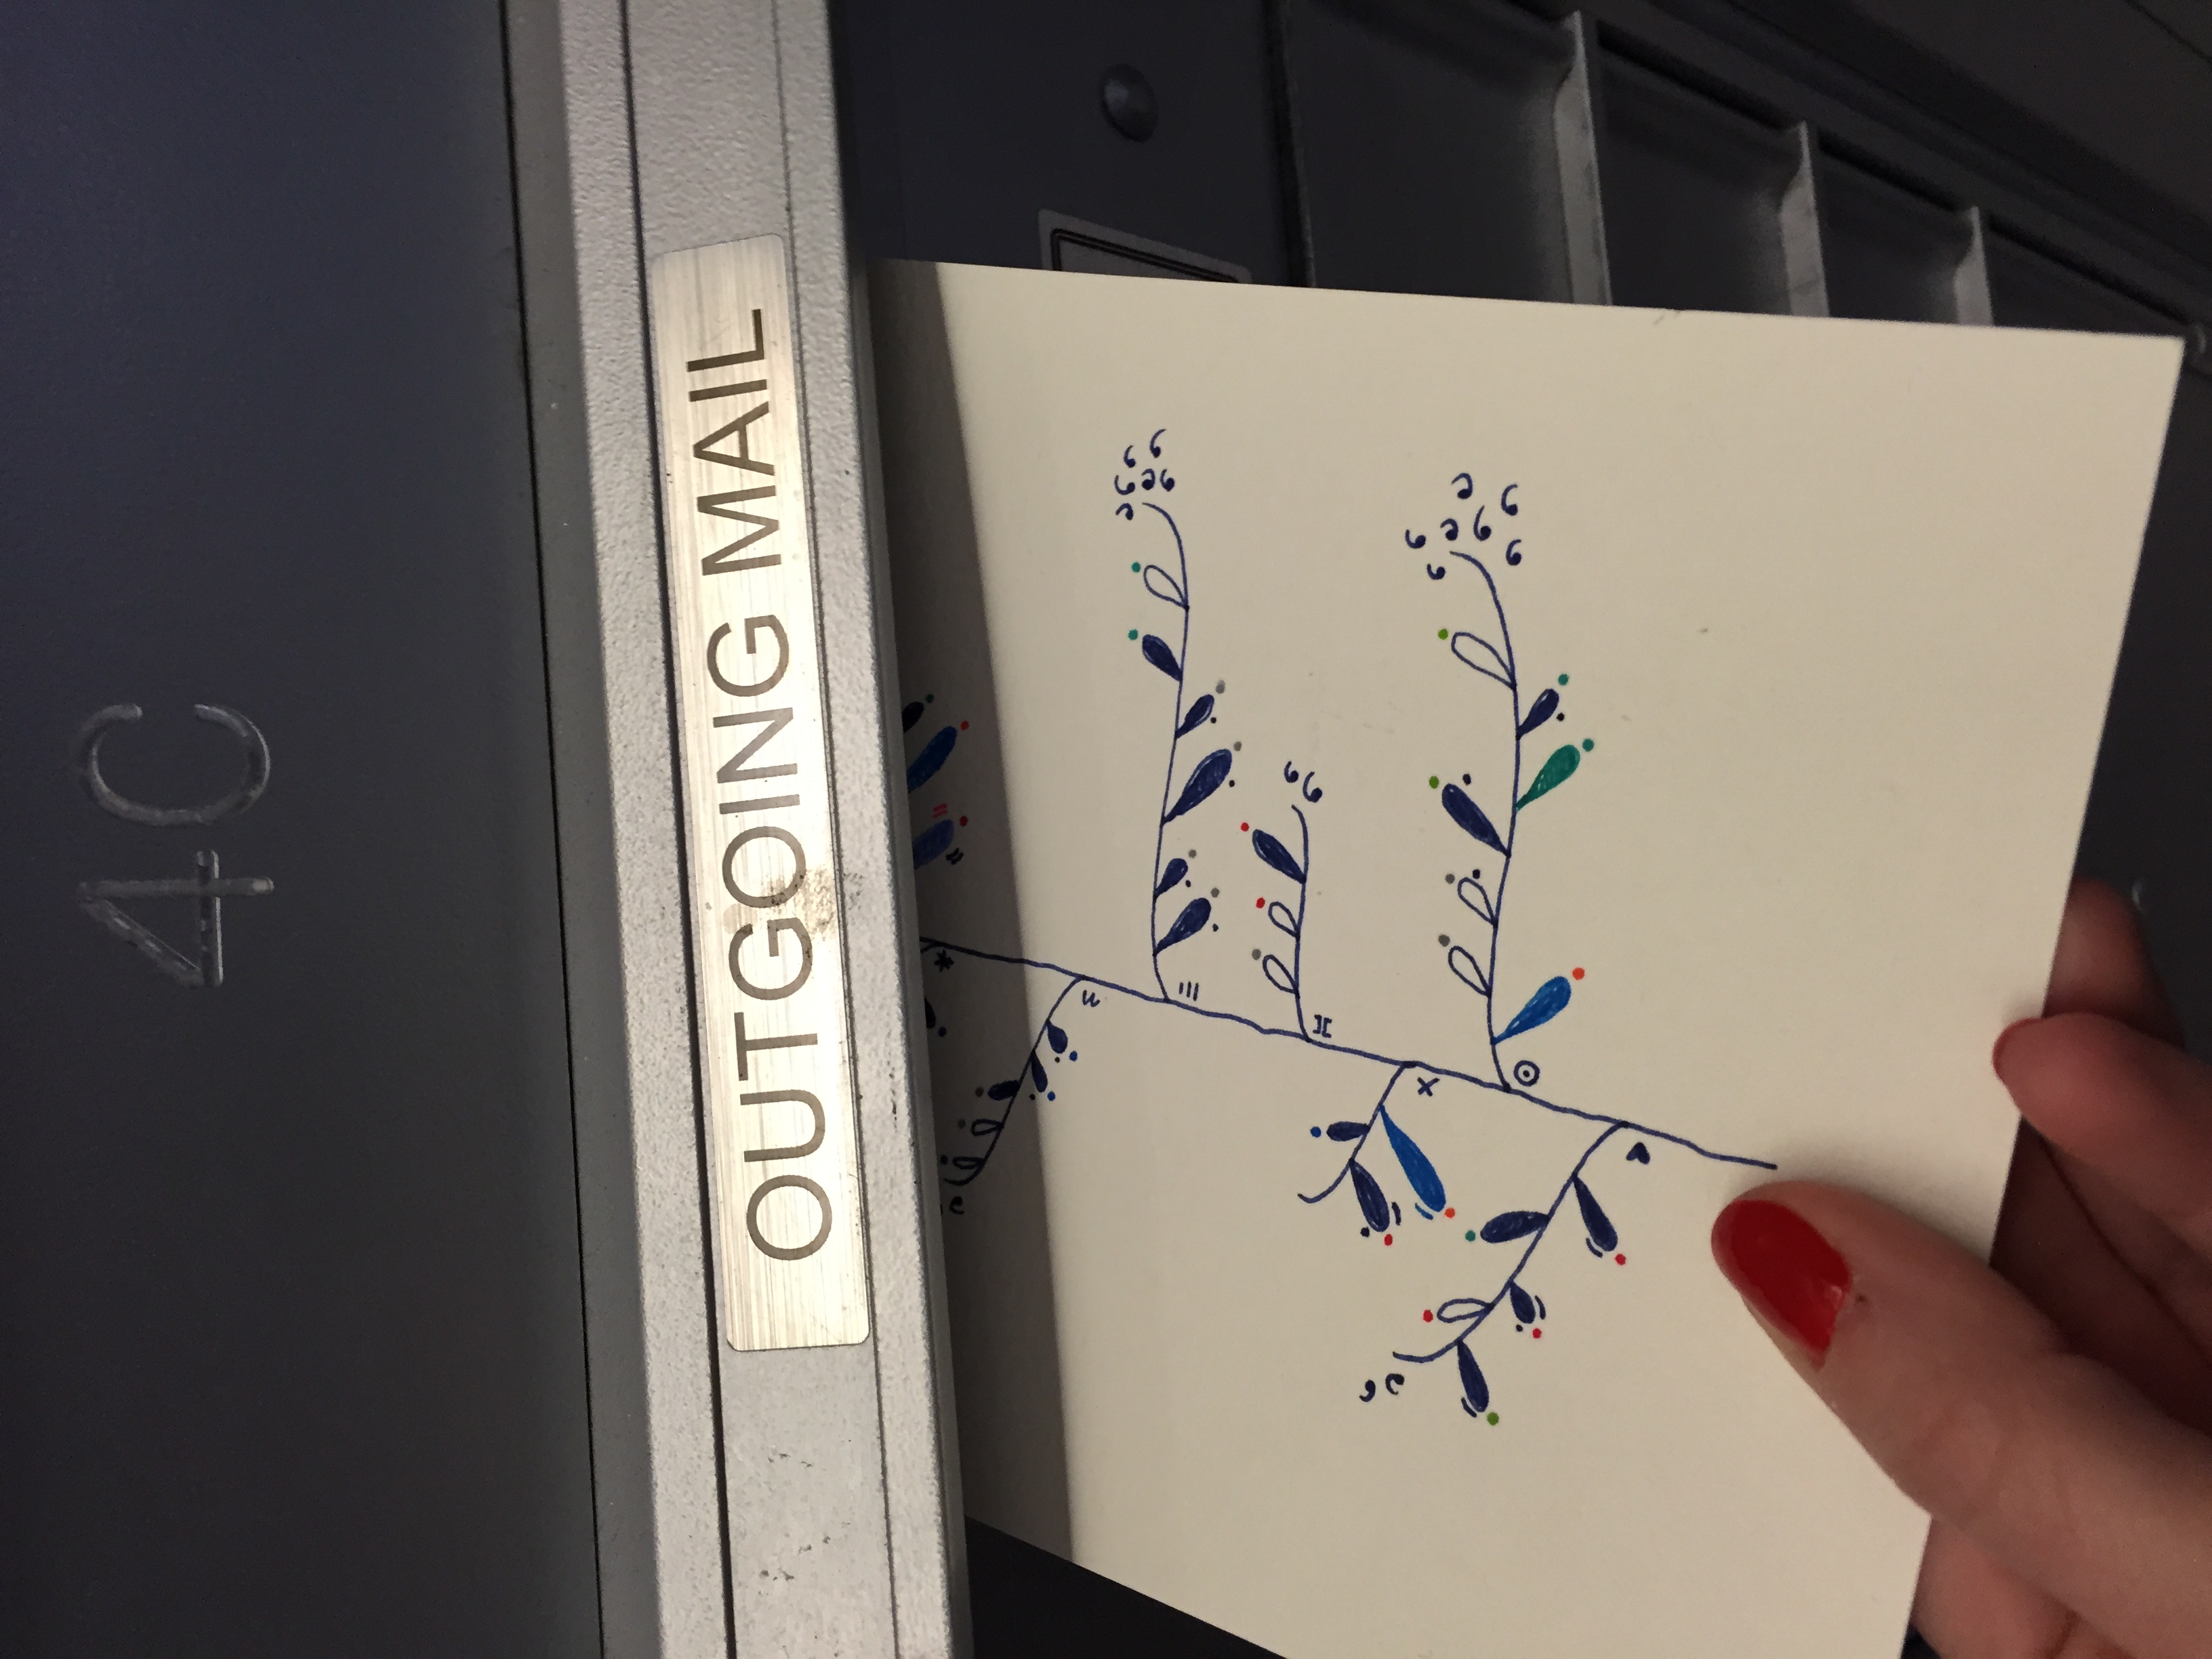
In my postcard, every “branch” of my blue media plant is a topic.
Since I read a lot about issues that are somehow related to my professional life, I divided the visualization into 2 separated parts, "personal stuff” sit on the upper part of my plant, while “professional stuff” compose the bottom.
Every “leaf” is a single article or piece of content I consumed, if the leaf is on the right of the branch it means that article or information definitely clicked with me, I liked it a lot; if it is on the left it means it was just ok; I also indicated the ones I didn’t manage to finish for multiple reasons.
Attributes about the kind of media content, the length / reading time are included, and I also added tangential information about what I was doing / where I was, whether I forwarded t to somebody or not, and the source.
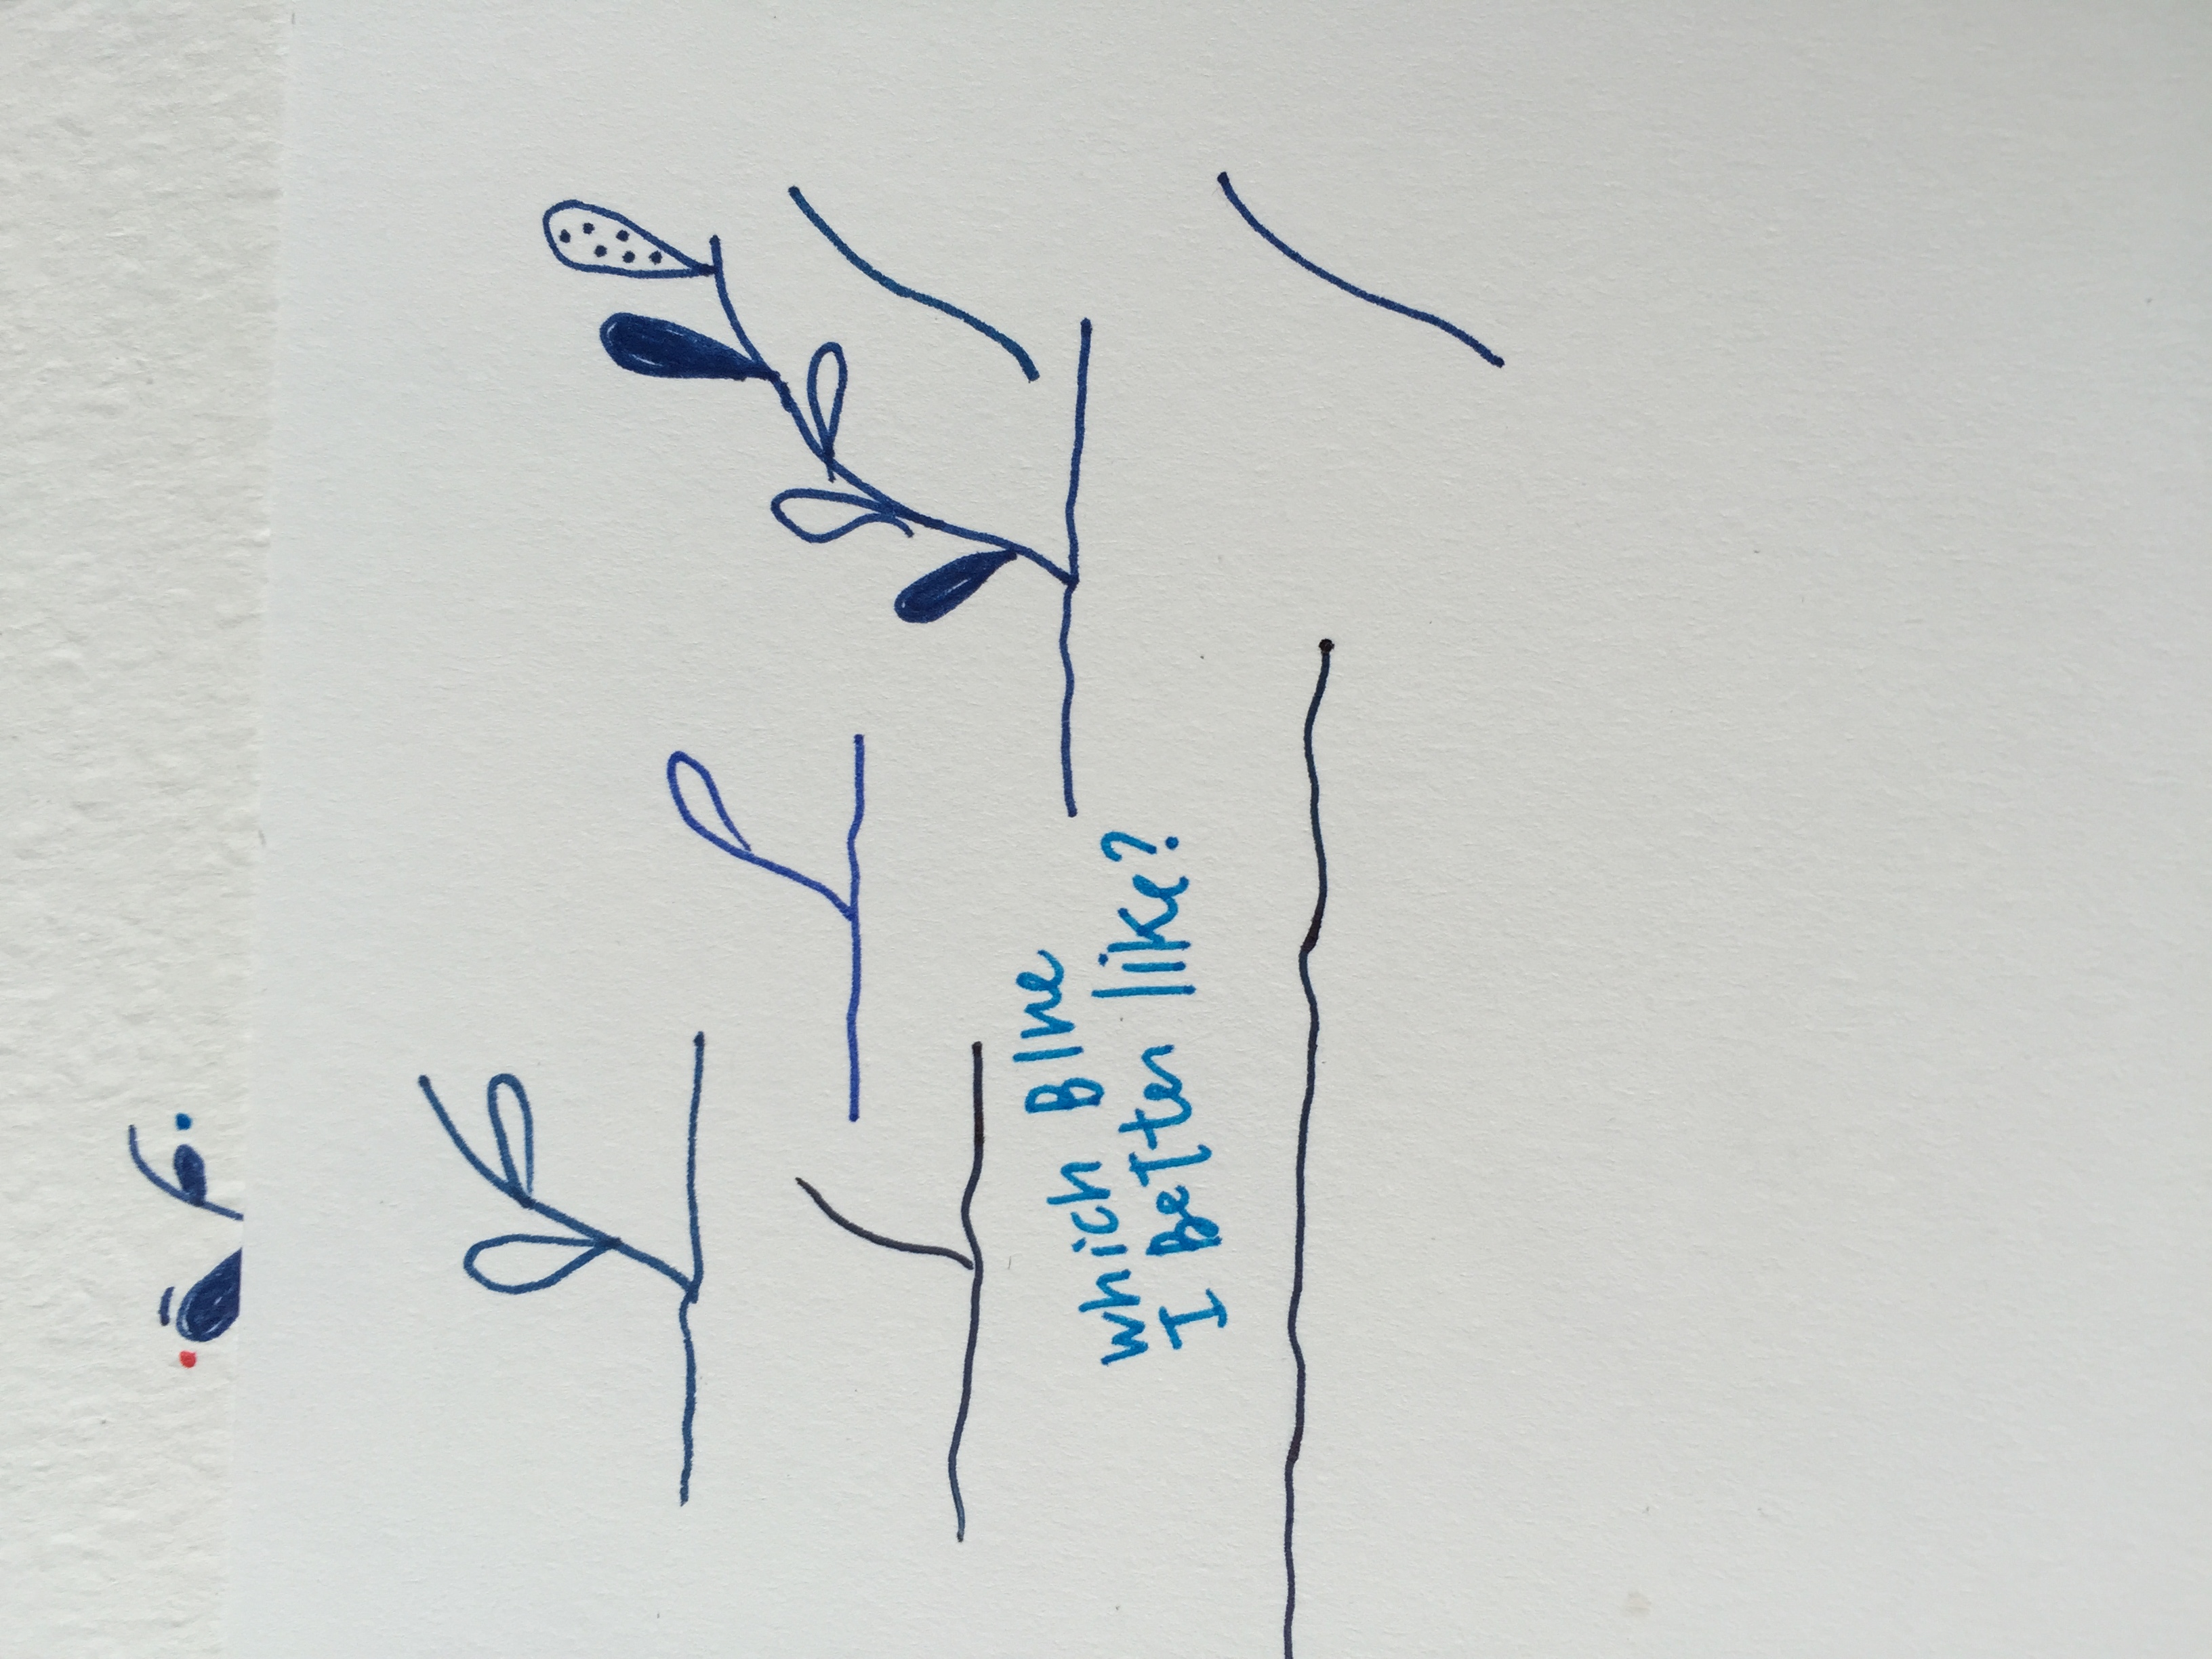
I wanted to experiment with a single color and its’ variations, this time, so my postcard is very blueish, but I kind of like it!
www.dear-data.com
This was the week when we launched the Dear Data website (as you might have noticed, we keep a buffer in time - we are now drawing week 39’s postcard and we uploaded week 27).
Making Dear Data public was very important to us: of course you can have fun with a project,
but the moment when you open it to the world is a challenging one.
What we really like about the general response is that we are learning
that this type of projects touch people on many levels, and it was so
positive! Lots of different people, and not only designers and data geeks, write us to leave a note and say they like the project, and that they've been inspired by Dear Data!
I read a lot of personal self and motivational kind of books, and I've been following different experiments and each of them taught me something about myself and opened my curiosity to explore areas of my personality: if Dear Data could inspire or trigger even only a small number of people to get deeper in their lives, I am just happy and fulfilled !
The Process:


Stefanie
(Well, we are halfway through the project, and I’m tired of my previous written format, so will be writing freeform from now on)
This was the week where we agreed to track any media we consumed. Unfortunately, while I agreed to this, I completely forgot to do any tracking at all, thus making this week the biggest data void of the project. So, I had to find a solution, and the solution was to just look at what I consumed on the web browser on my phone and my laptop since I spend most of my time there during the week.
Regardless of this week’s massive ‘data void’, this data generally highlights the topics that I consume in the media: news, art & design, London, science, and so on. The only continual media consumption that is missing this week due to my forgetfulness is watching boxsets of TV shows and habitual reading of the Guardian on its app (likely not many books, which is slightly shameful, considering I used to work in publishing). However, I think this slightly-empty week of data is still a reminder that I tend to consume quite a narrow slice of media, focusing on the same content and sites repeatedly instead of broadening what I read. Perhaps I need to set myself a personal challenge of consuming different media sources every week for some variety.
After gathering all this data, I tried to make the drawing look as detailed and aesthetically-pleasing as possible to detract attention from the flimsy data with the aim of focusing Giorgia’s attention on the aesthetic first and foremost.
I can’t remember much from my experiences from this week since I completely forgot to track, right? But when I look at the completely-drawn card, feelings of stress, fear, and worry begin to flood through me. This was a time of year where I was pretty busy with work and finding it difficult to cope, and so because of this, I wasn’t sleeping much and I kept forgetting things. [edit: WHAT? This was the week we launched dear-data.com? NO WONDER I forgot to track this week, and this week felt so busy and stressful! Currently kicking myself and laughing...] Even when I don’t technically represent this type of information in the card, the card becomes a physical marker of my memories, reminding me of what was happening in my life during the time I sent this postcard to Giorgia.
I often find that working on a weekly project can be a challenge to fit into the rest of one’s life sometimes. I fail at this often, but I don’t mind too much: I’m doing the best I can to regularly incorporate drawing and data into my daily life, and some weeks it’s easier than others. I do think Giorgia is much better at time management than I am, so this is something that I need to get better at.
As for Giorgia’s card, her drawing this week seems to be a contrast to some of the previous drawings that were neatly-organised and more geometric. I like this more organic drawing, and it seems to allude more to the organic way that we consume media: it’s something that happens slowly through the week, and the content winds itself around our minds and our actions for the week, sinking into our consciousness.
I like how detailed Giorgia’s card is this week as it sets the scene of her week in my mind, and I can imagine her in different locations, reading and passing articles onto friends or her boyfriend. My favourite part of the card is where she notes down that she was consuming an article while walking, as this is one of my (potentially bad) habits as well: I walk and scroll though my phone at the same time. However, before anyone says we are phone-addicted, I think this sort of behaviour is allowed when you walk long distances in a big city: walking is like driving a car, or riding on the bus: you end up multi-tasking!
The Process:

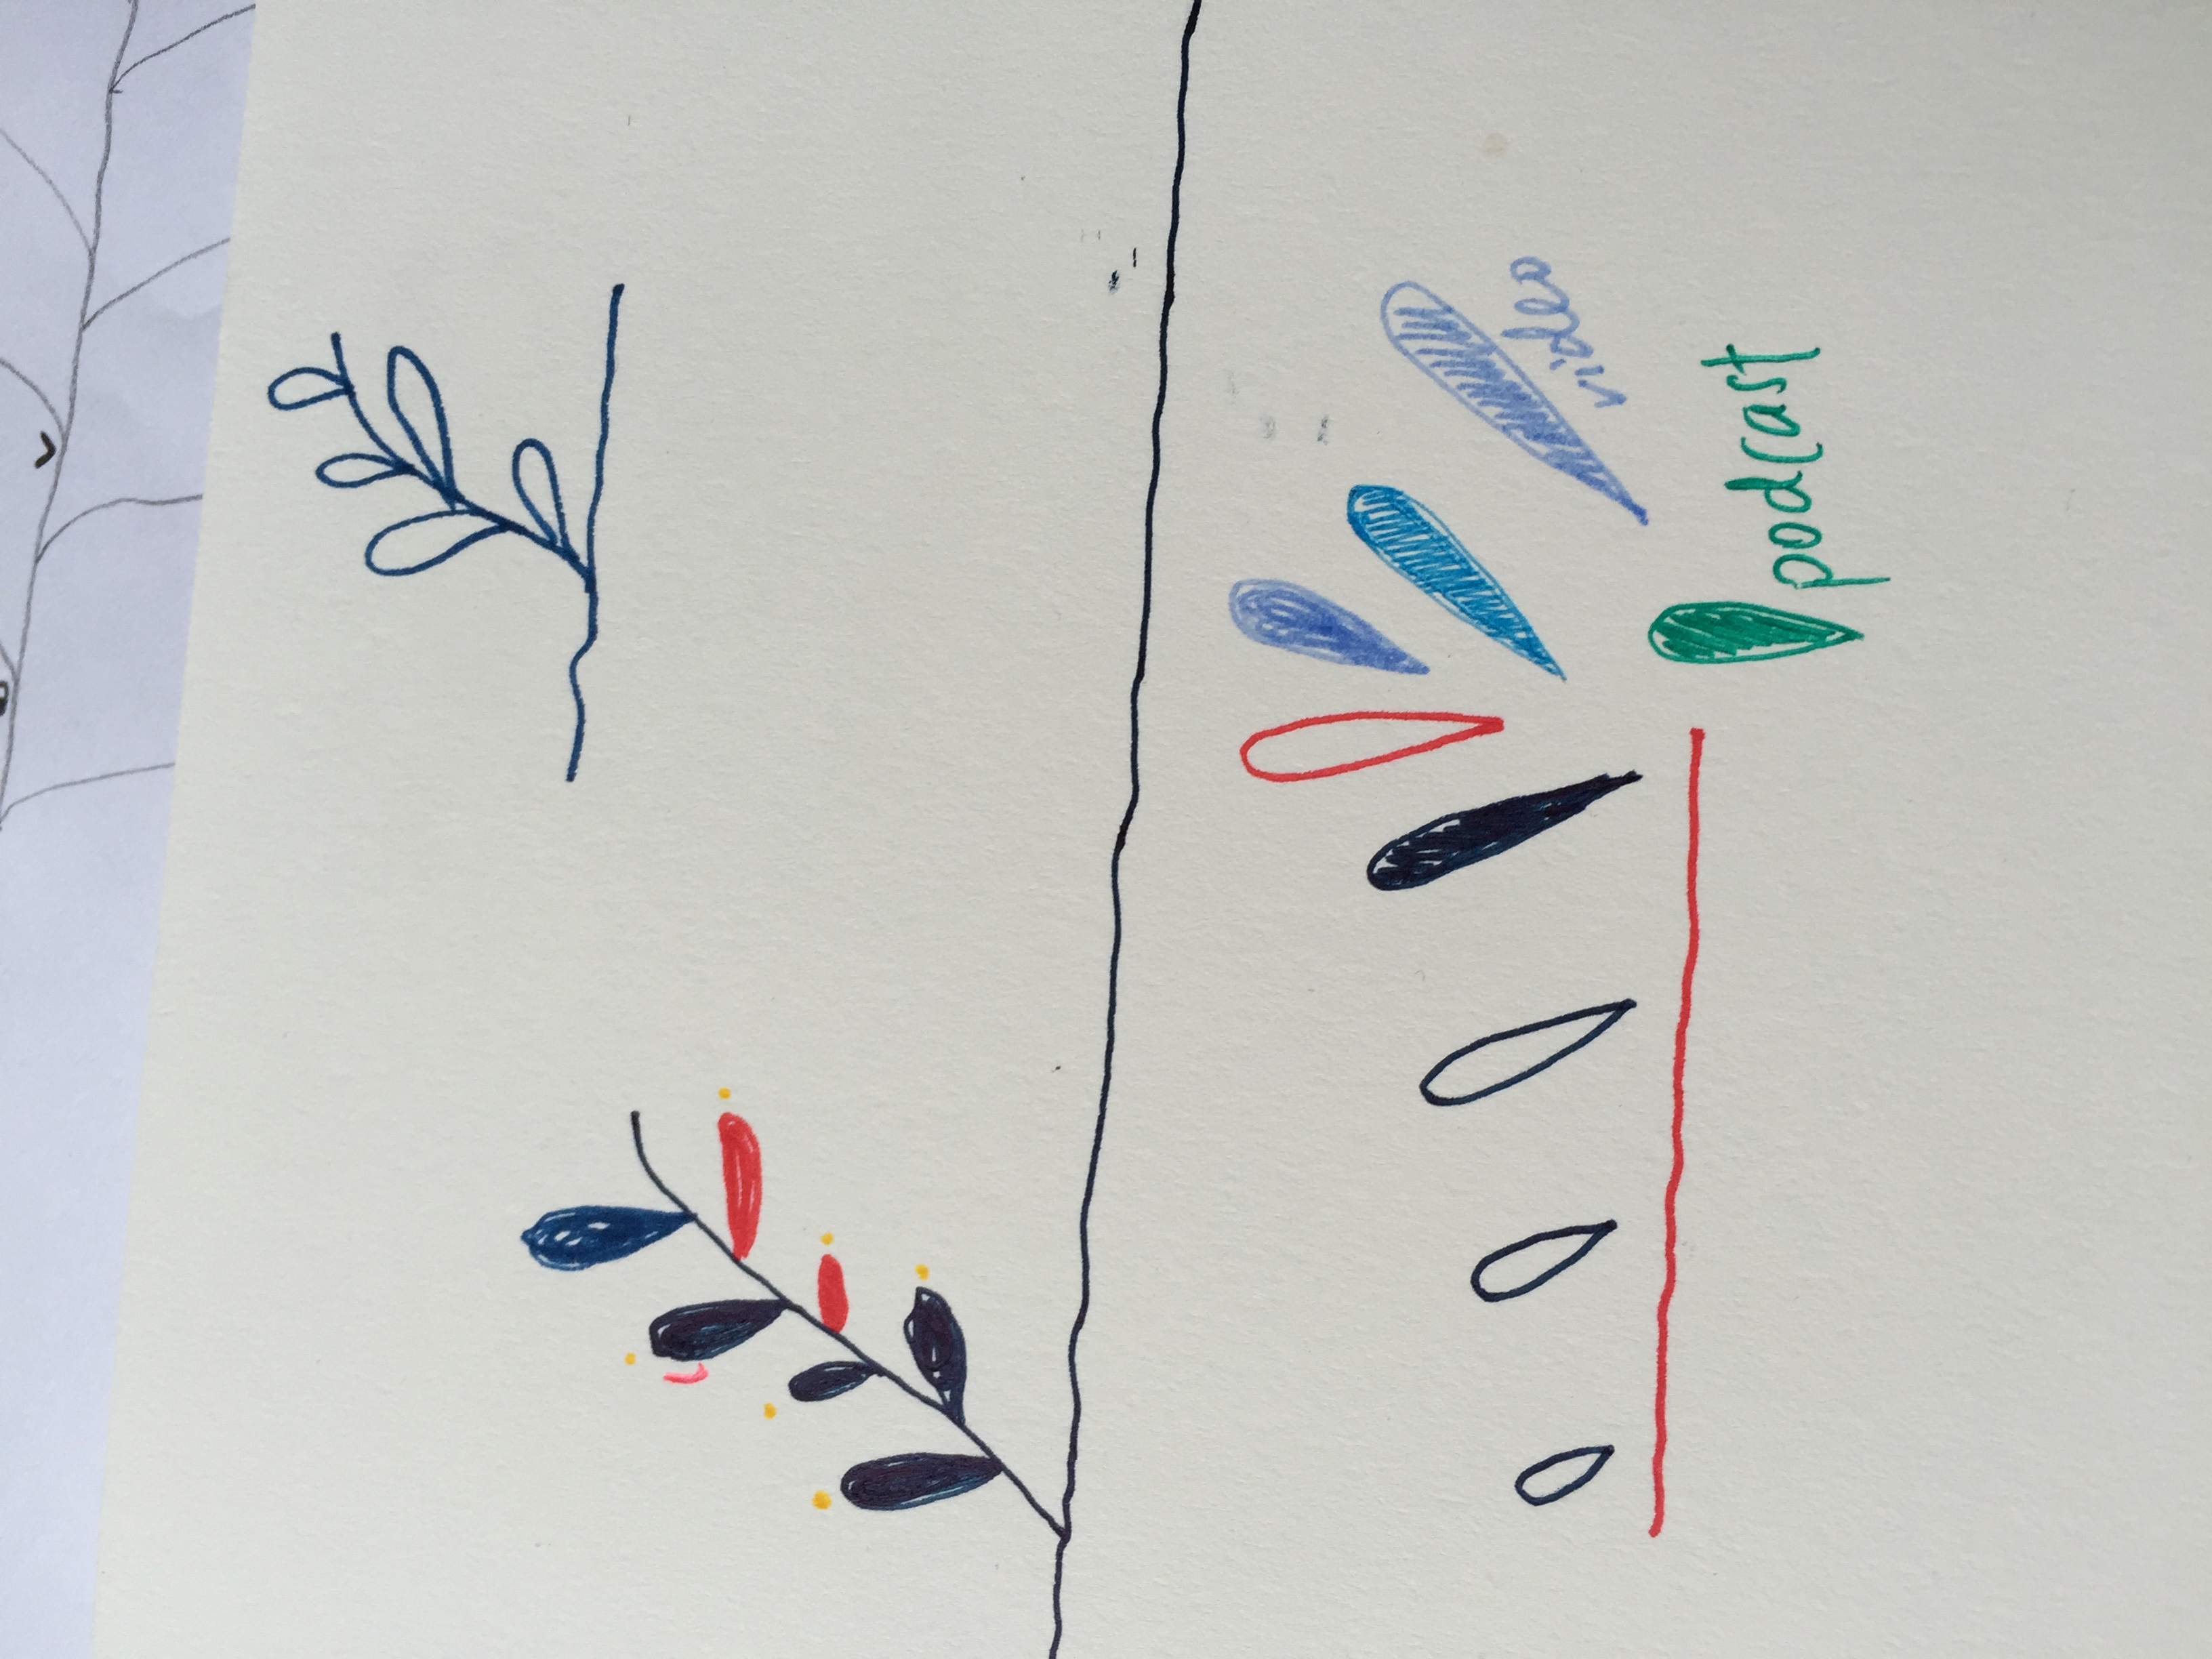
Testing the spacing of the drawing...

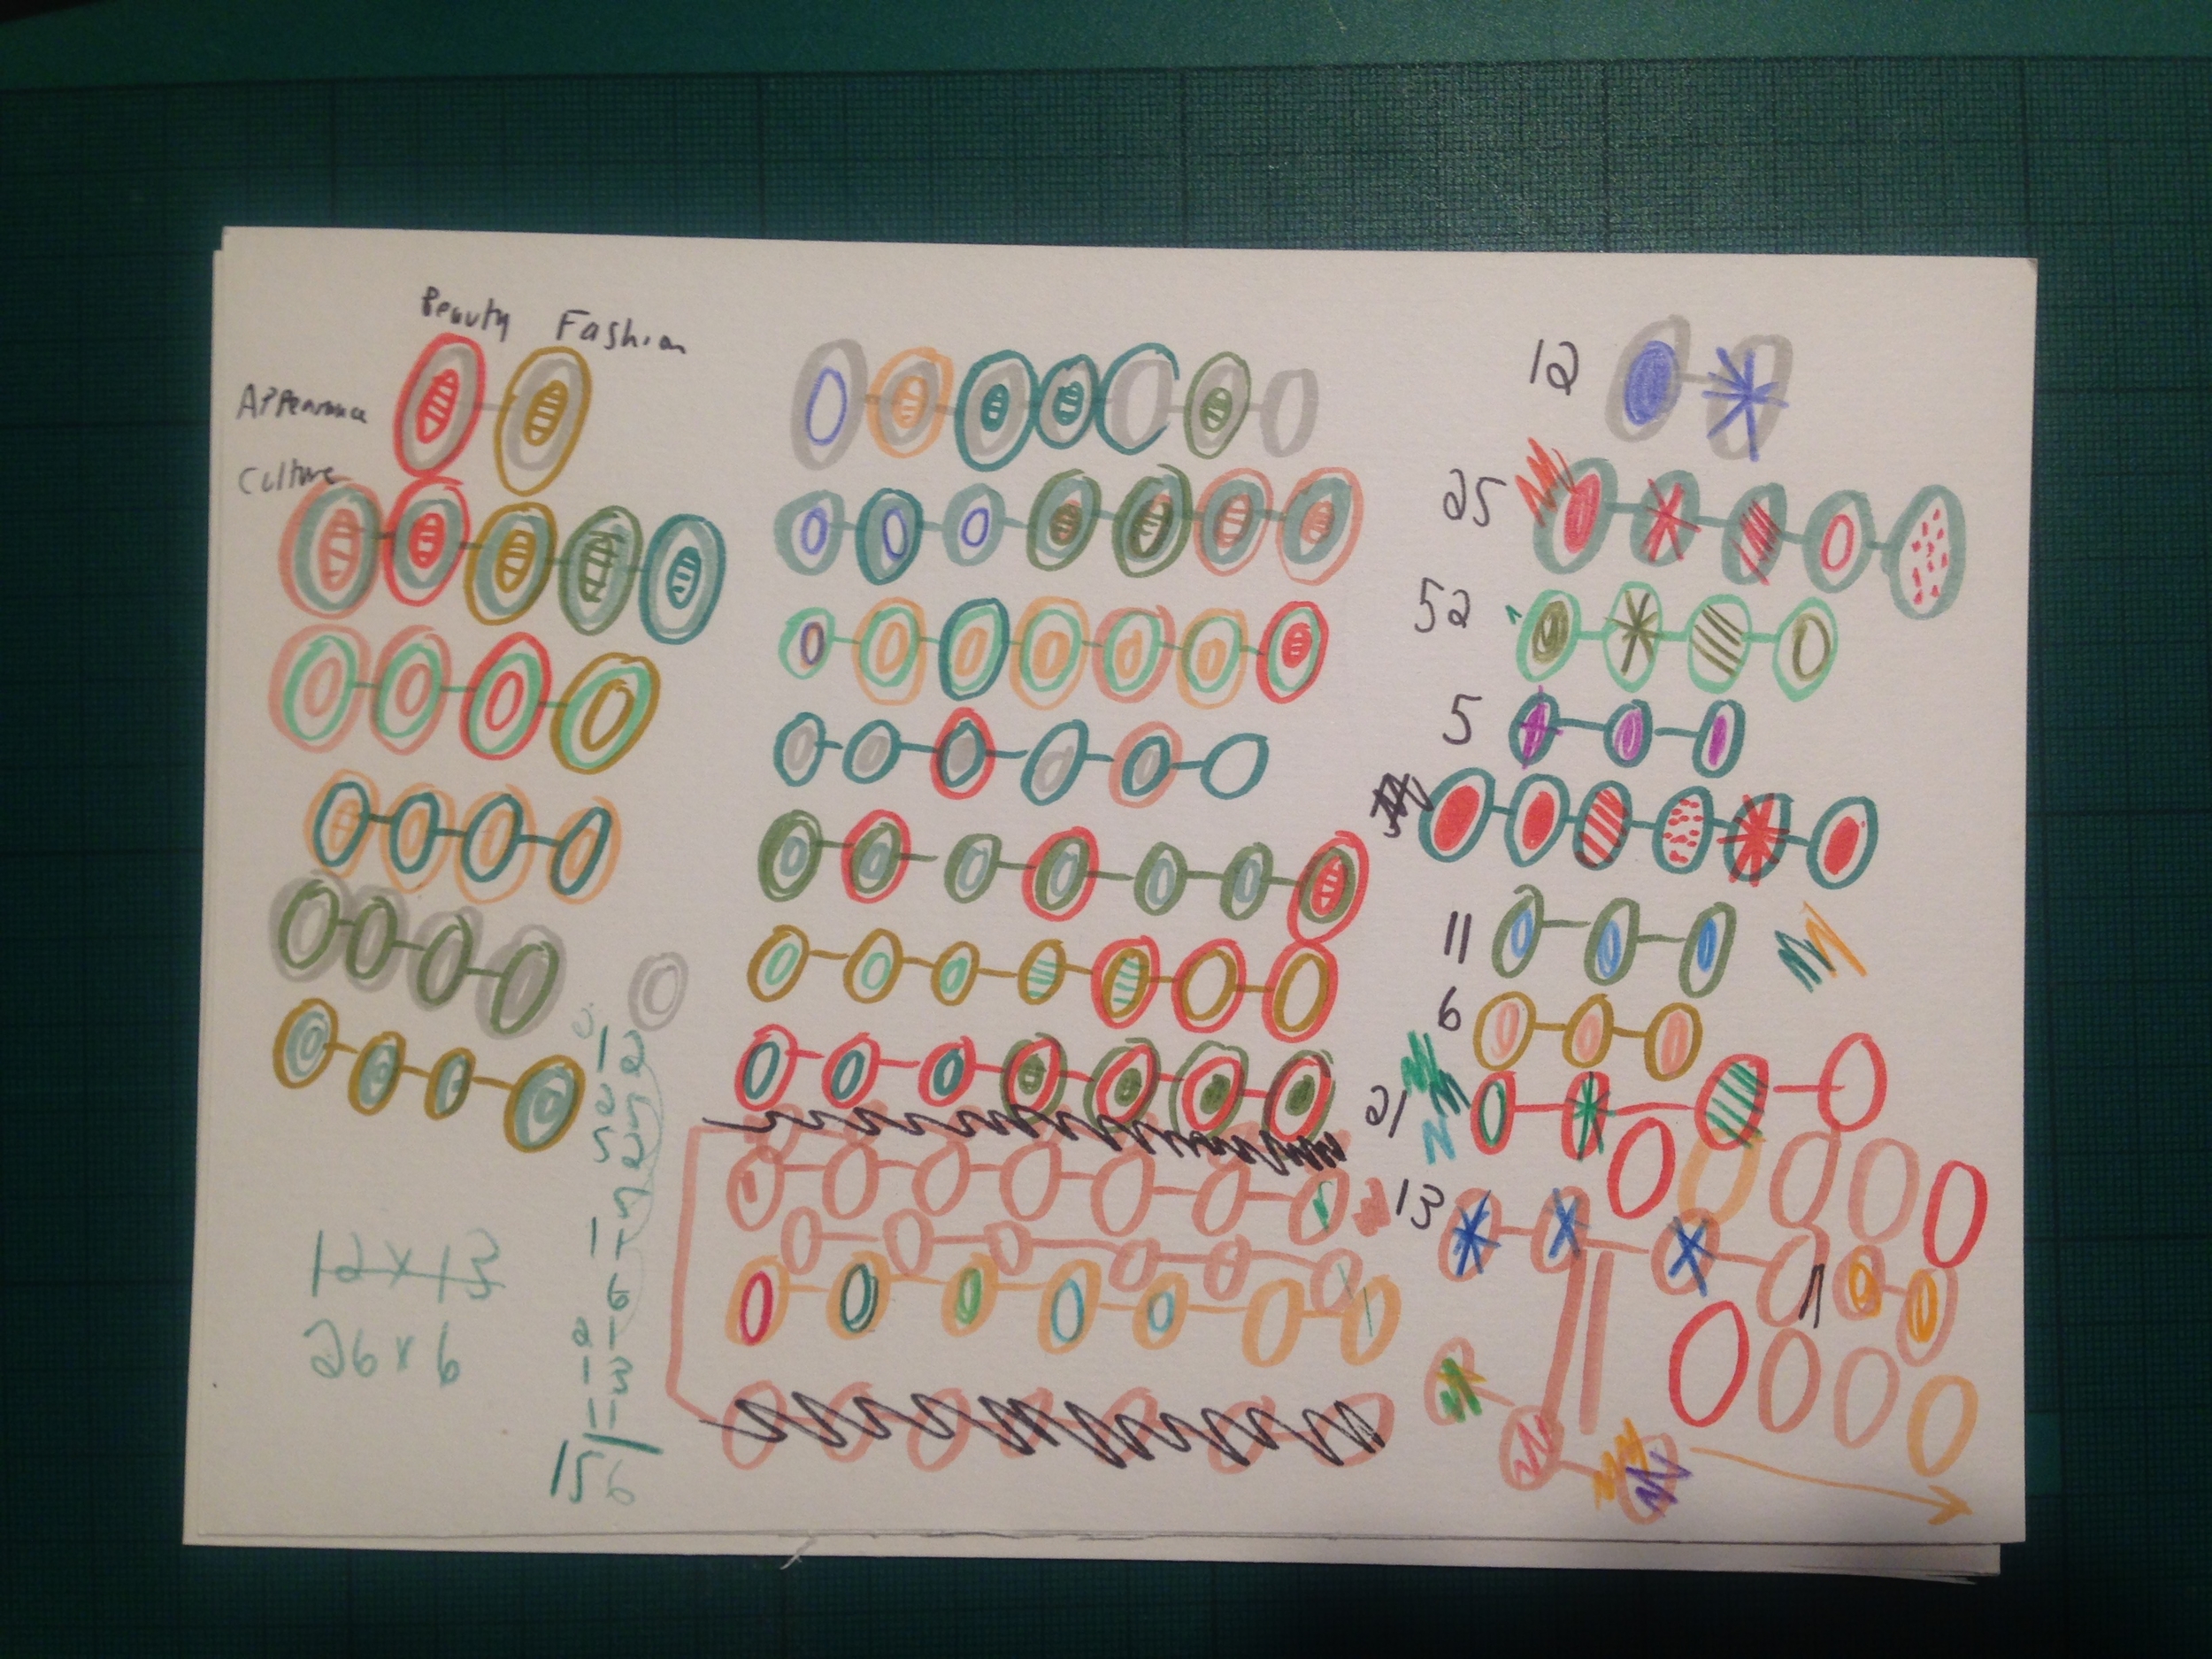
Sometimes I like my test drawings more than the final...
