Week 49:
A week of 'data'


Giorgia
Meta-data!
Given we both work with data in our day job, and we’re also working with it with this side project, it sounded interesting to treat the word ‘data’ as a dataset for our week 49, before ending the project.
How do we use it? In what situations? With whom? Can we find any patterns or interesting stories on it?
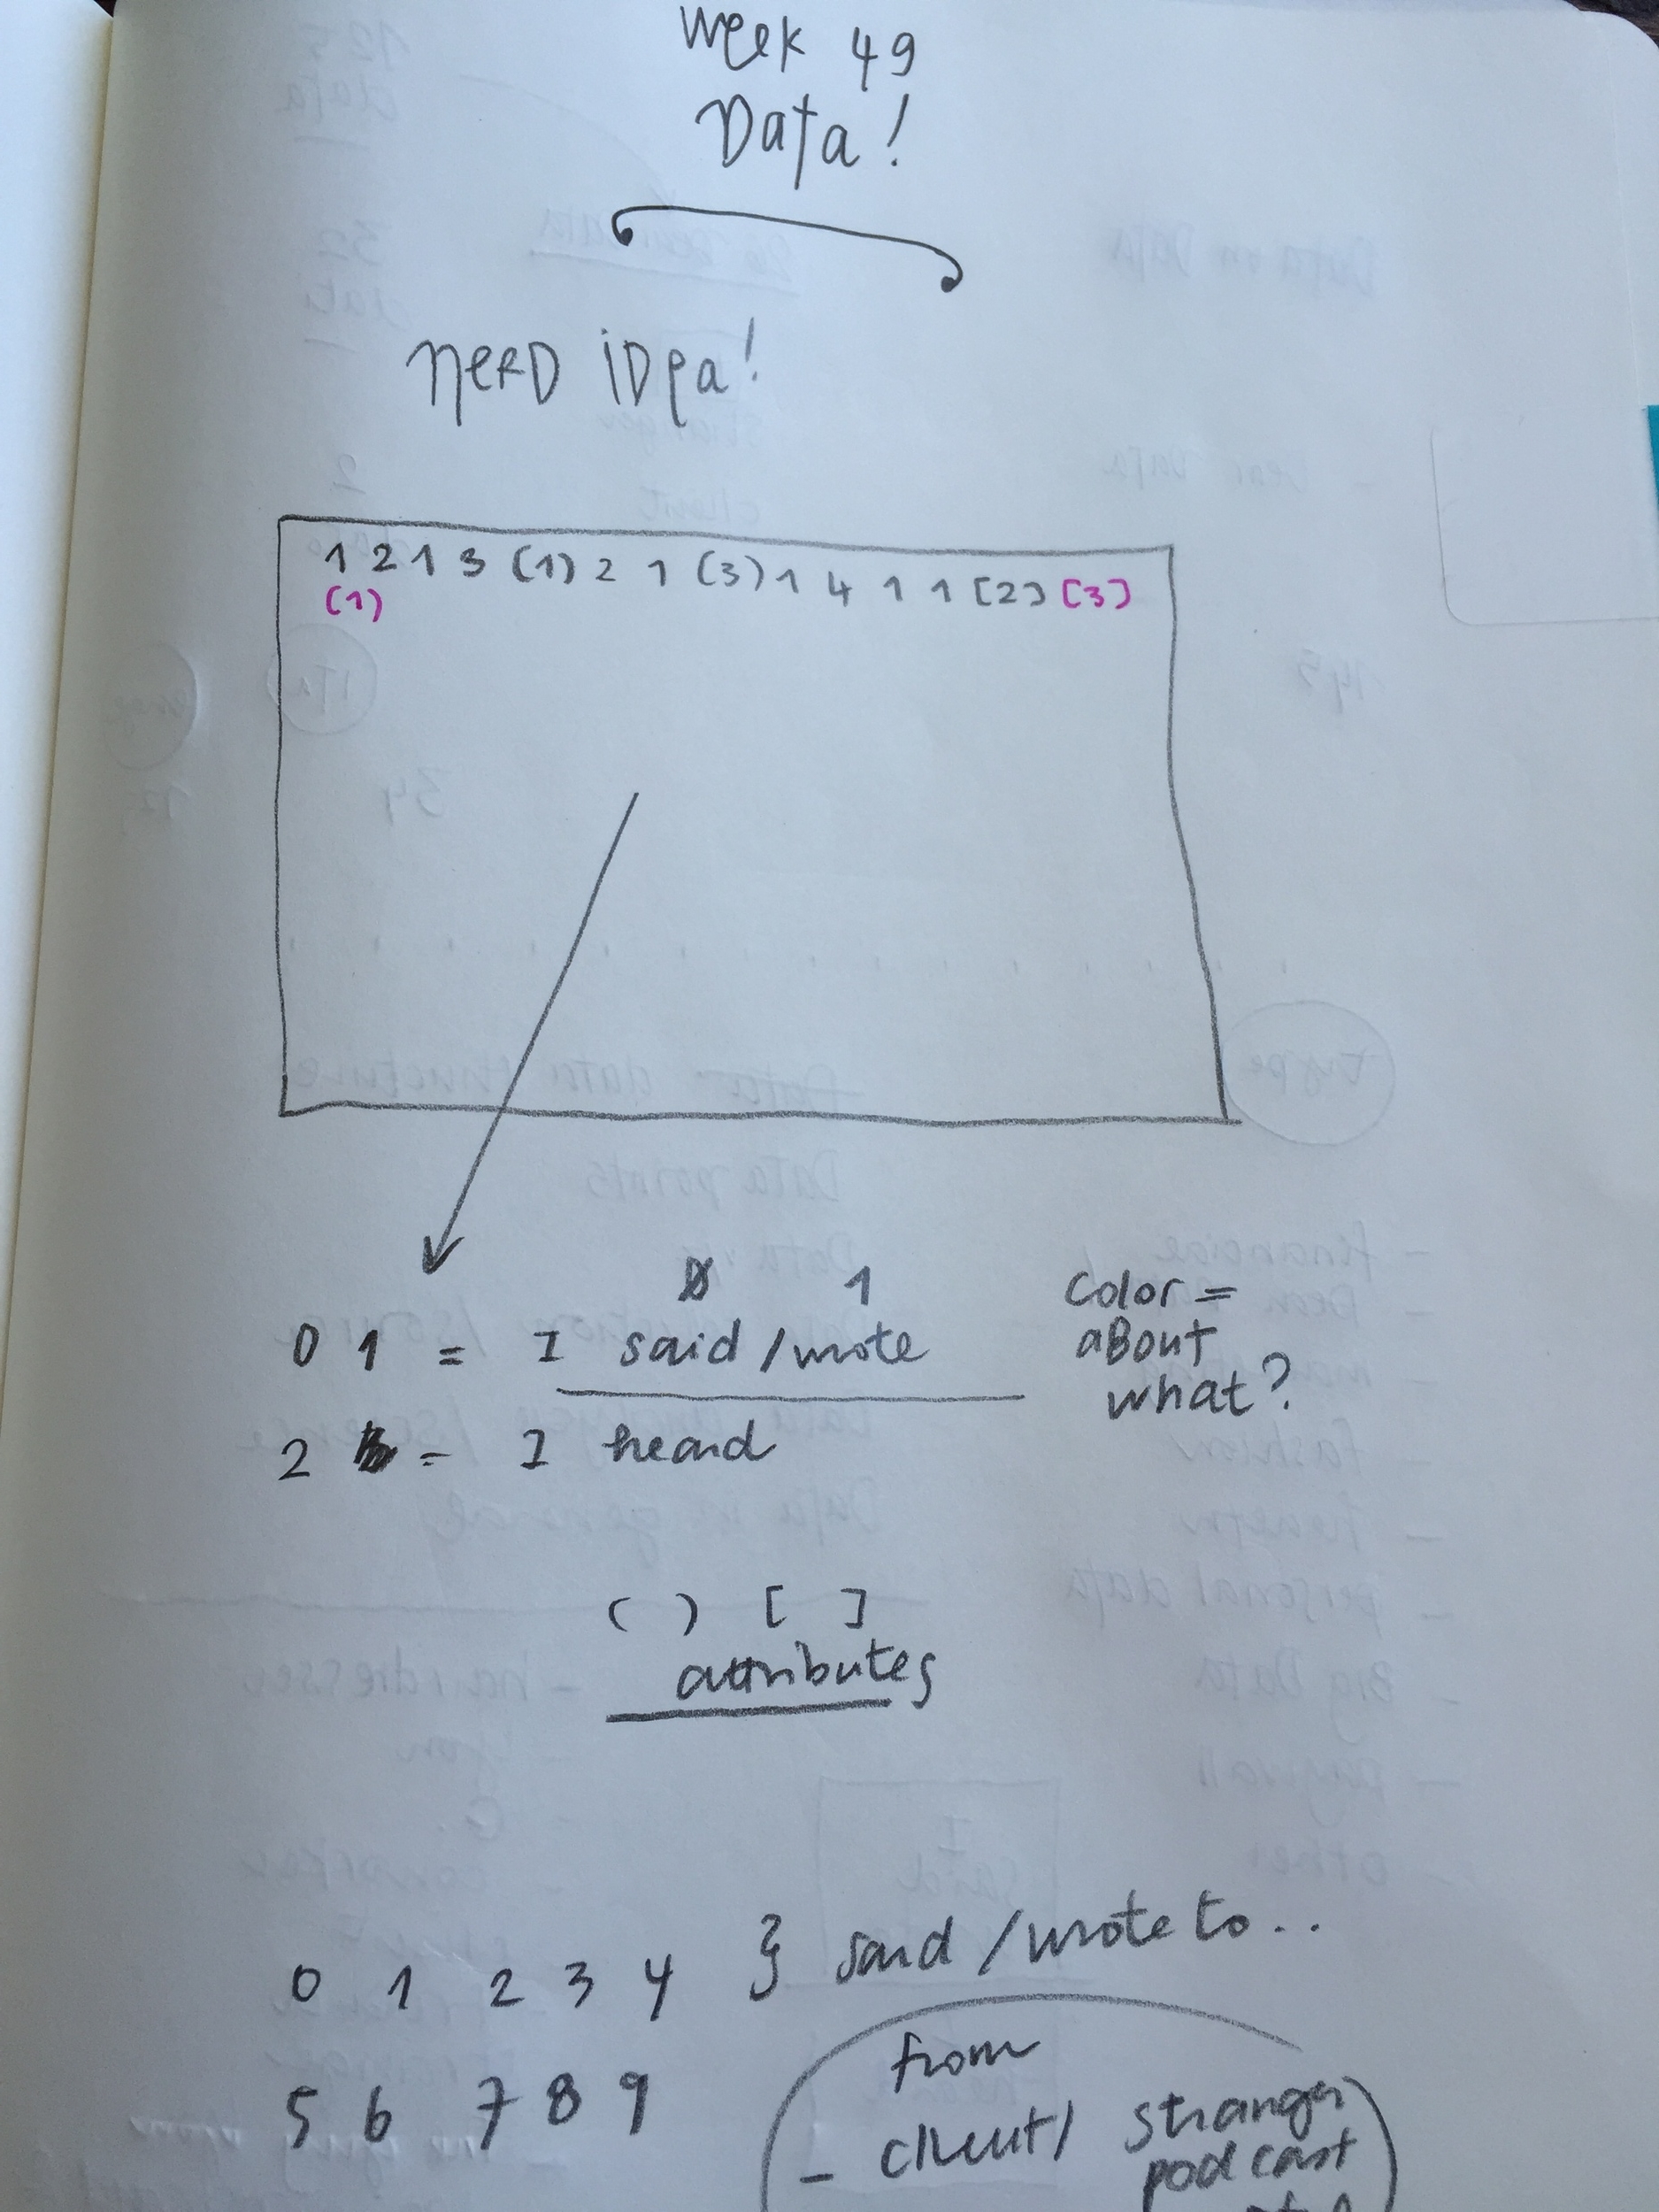
I collected all of the time I said and wrote the word “data” down (and the Italian version of it, which actually has a plural version (s: dato, p:dati), and the times I’ve heard it mentioned by somebody else.
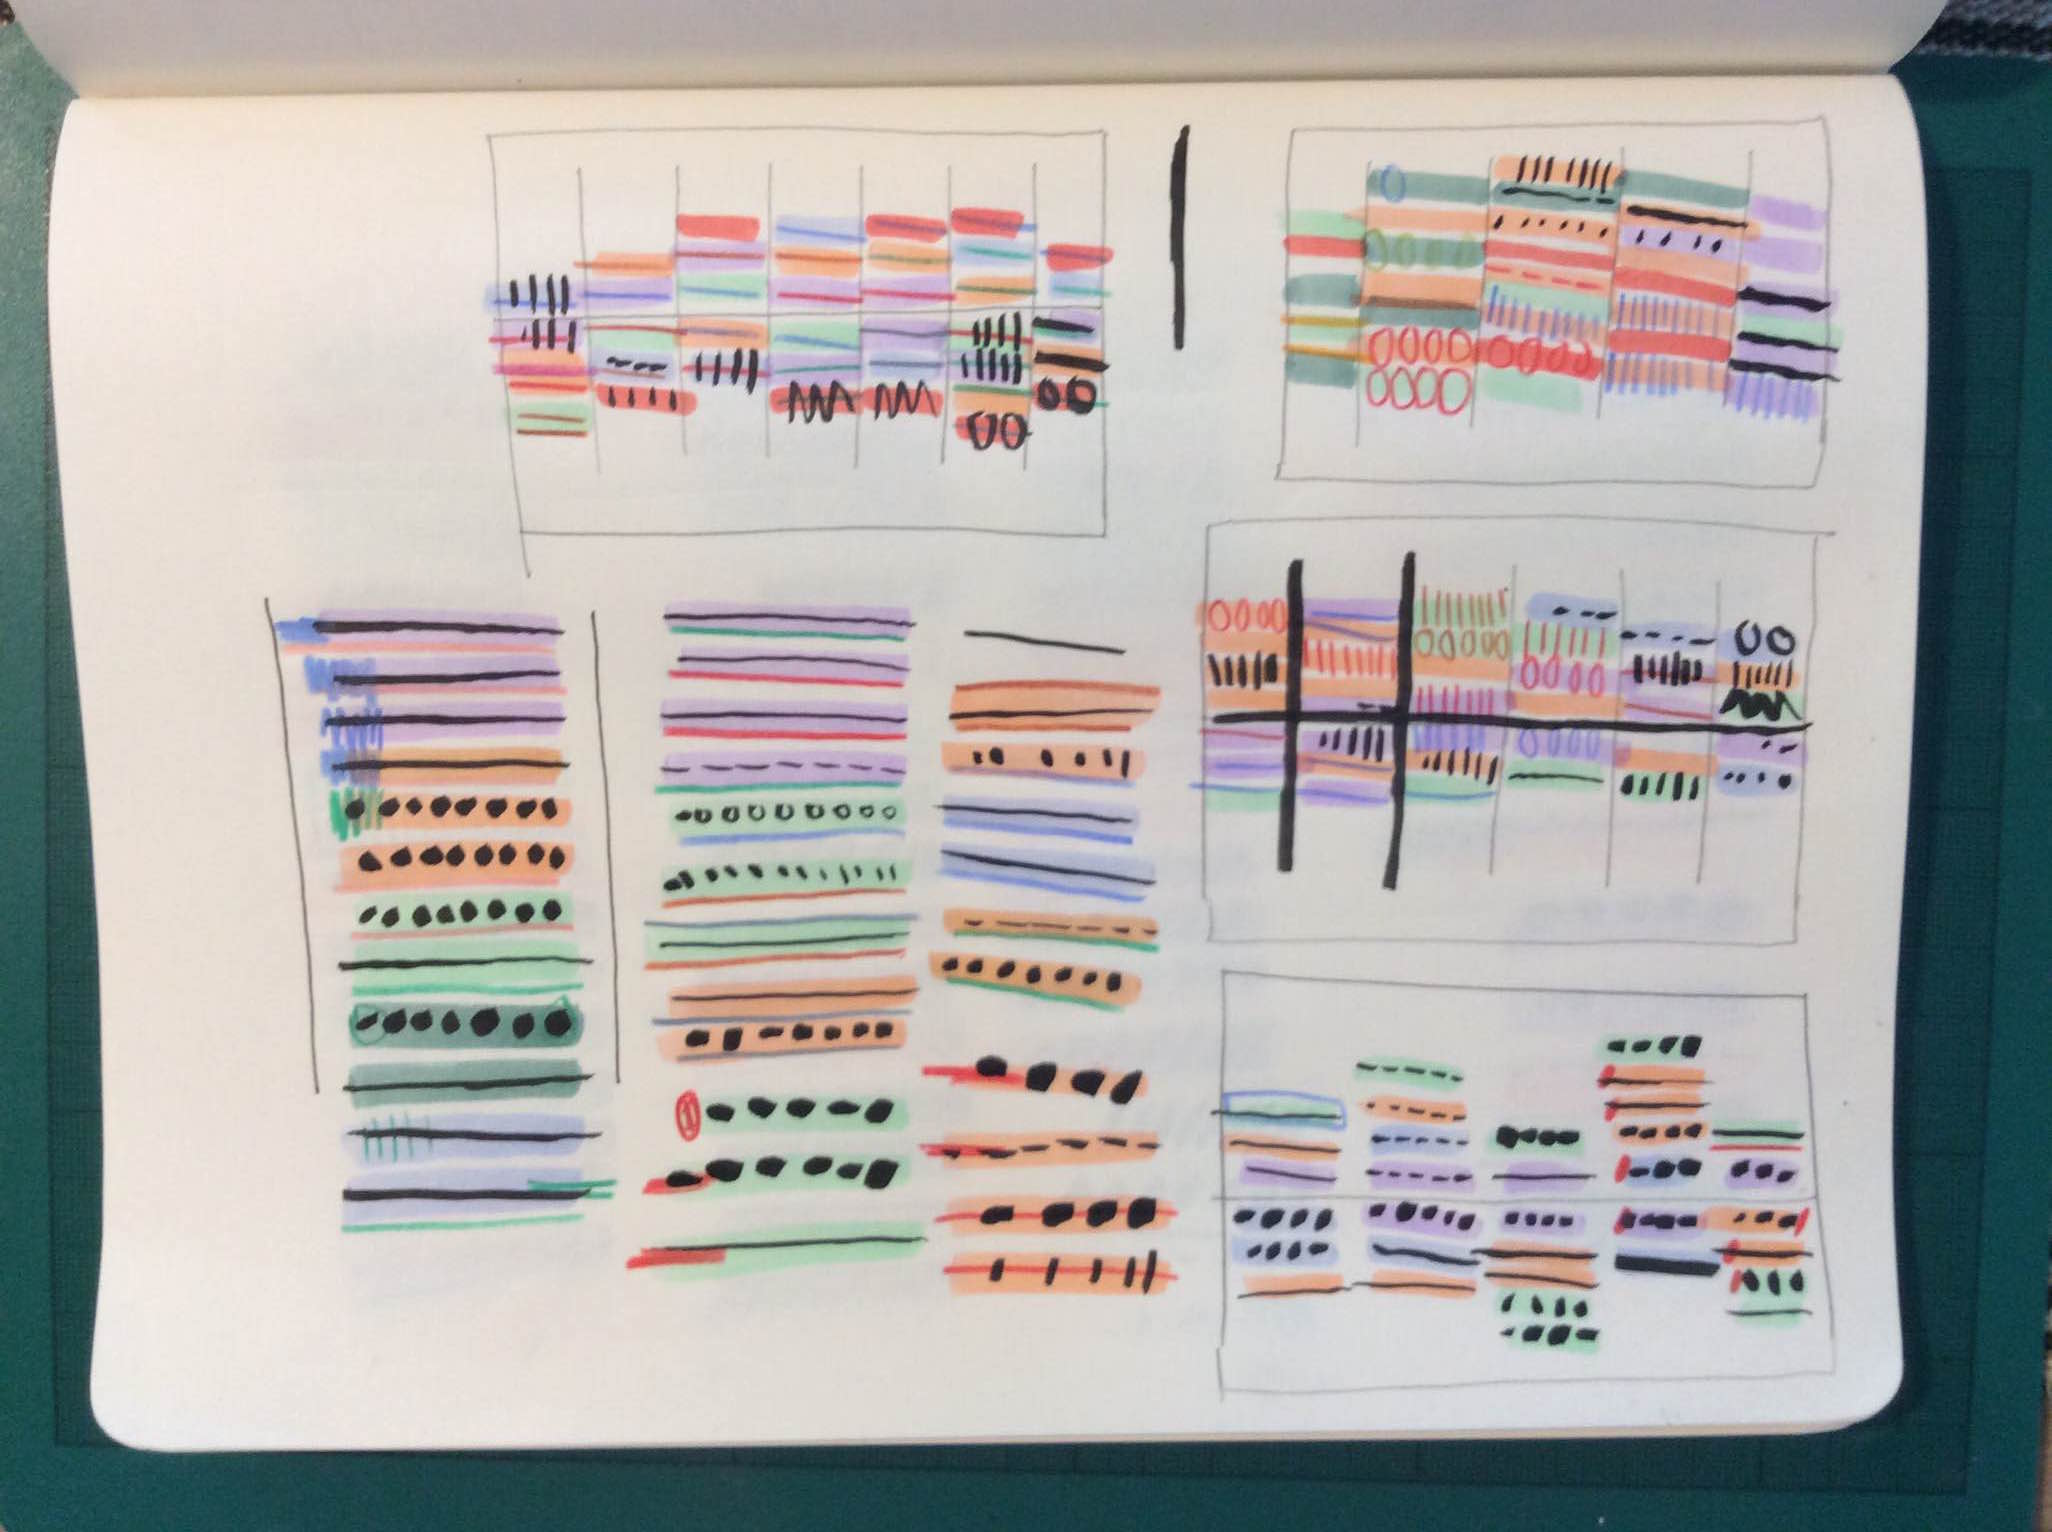
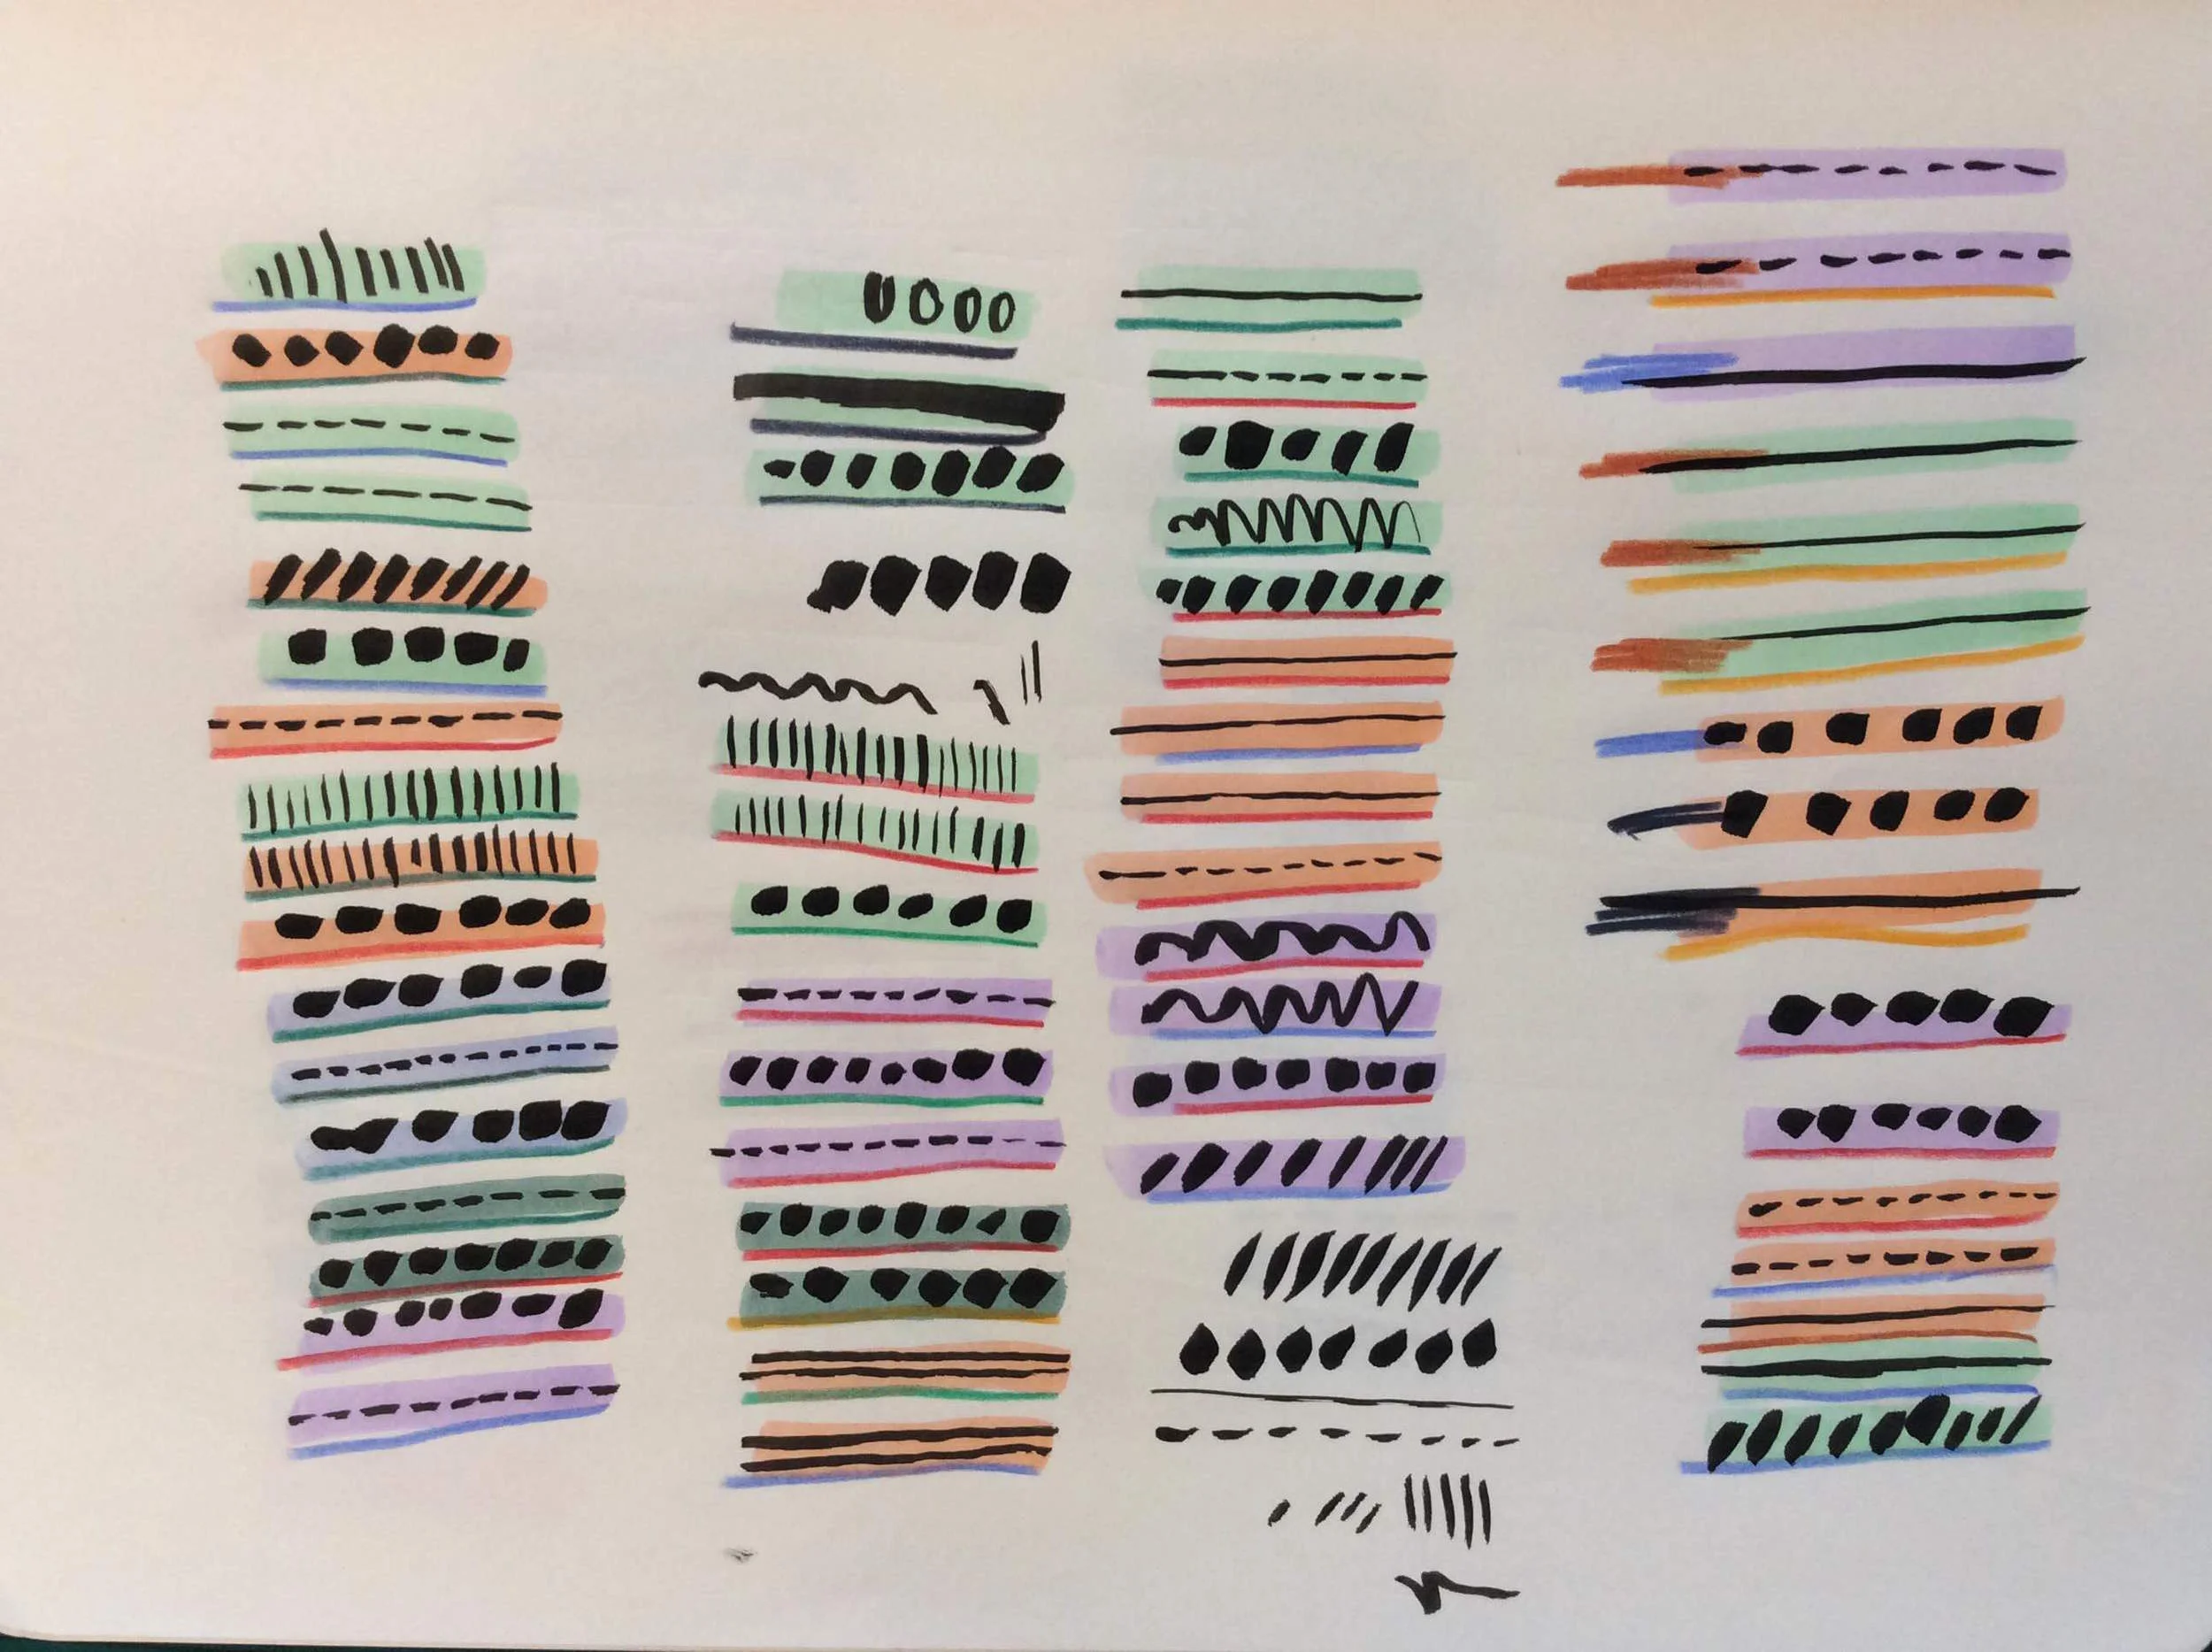
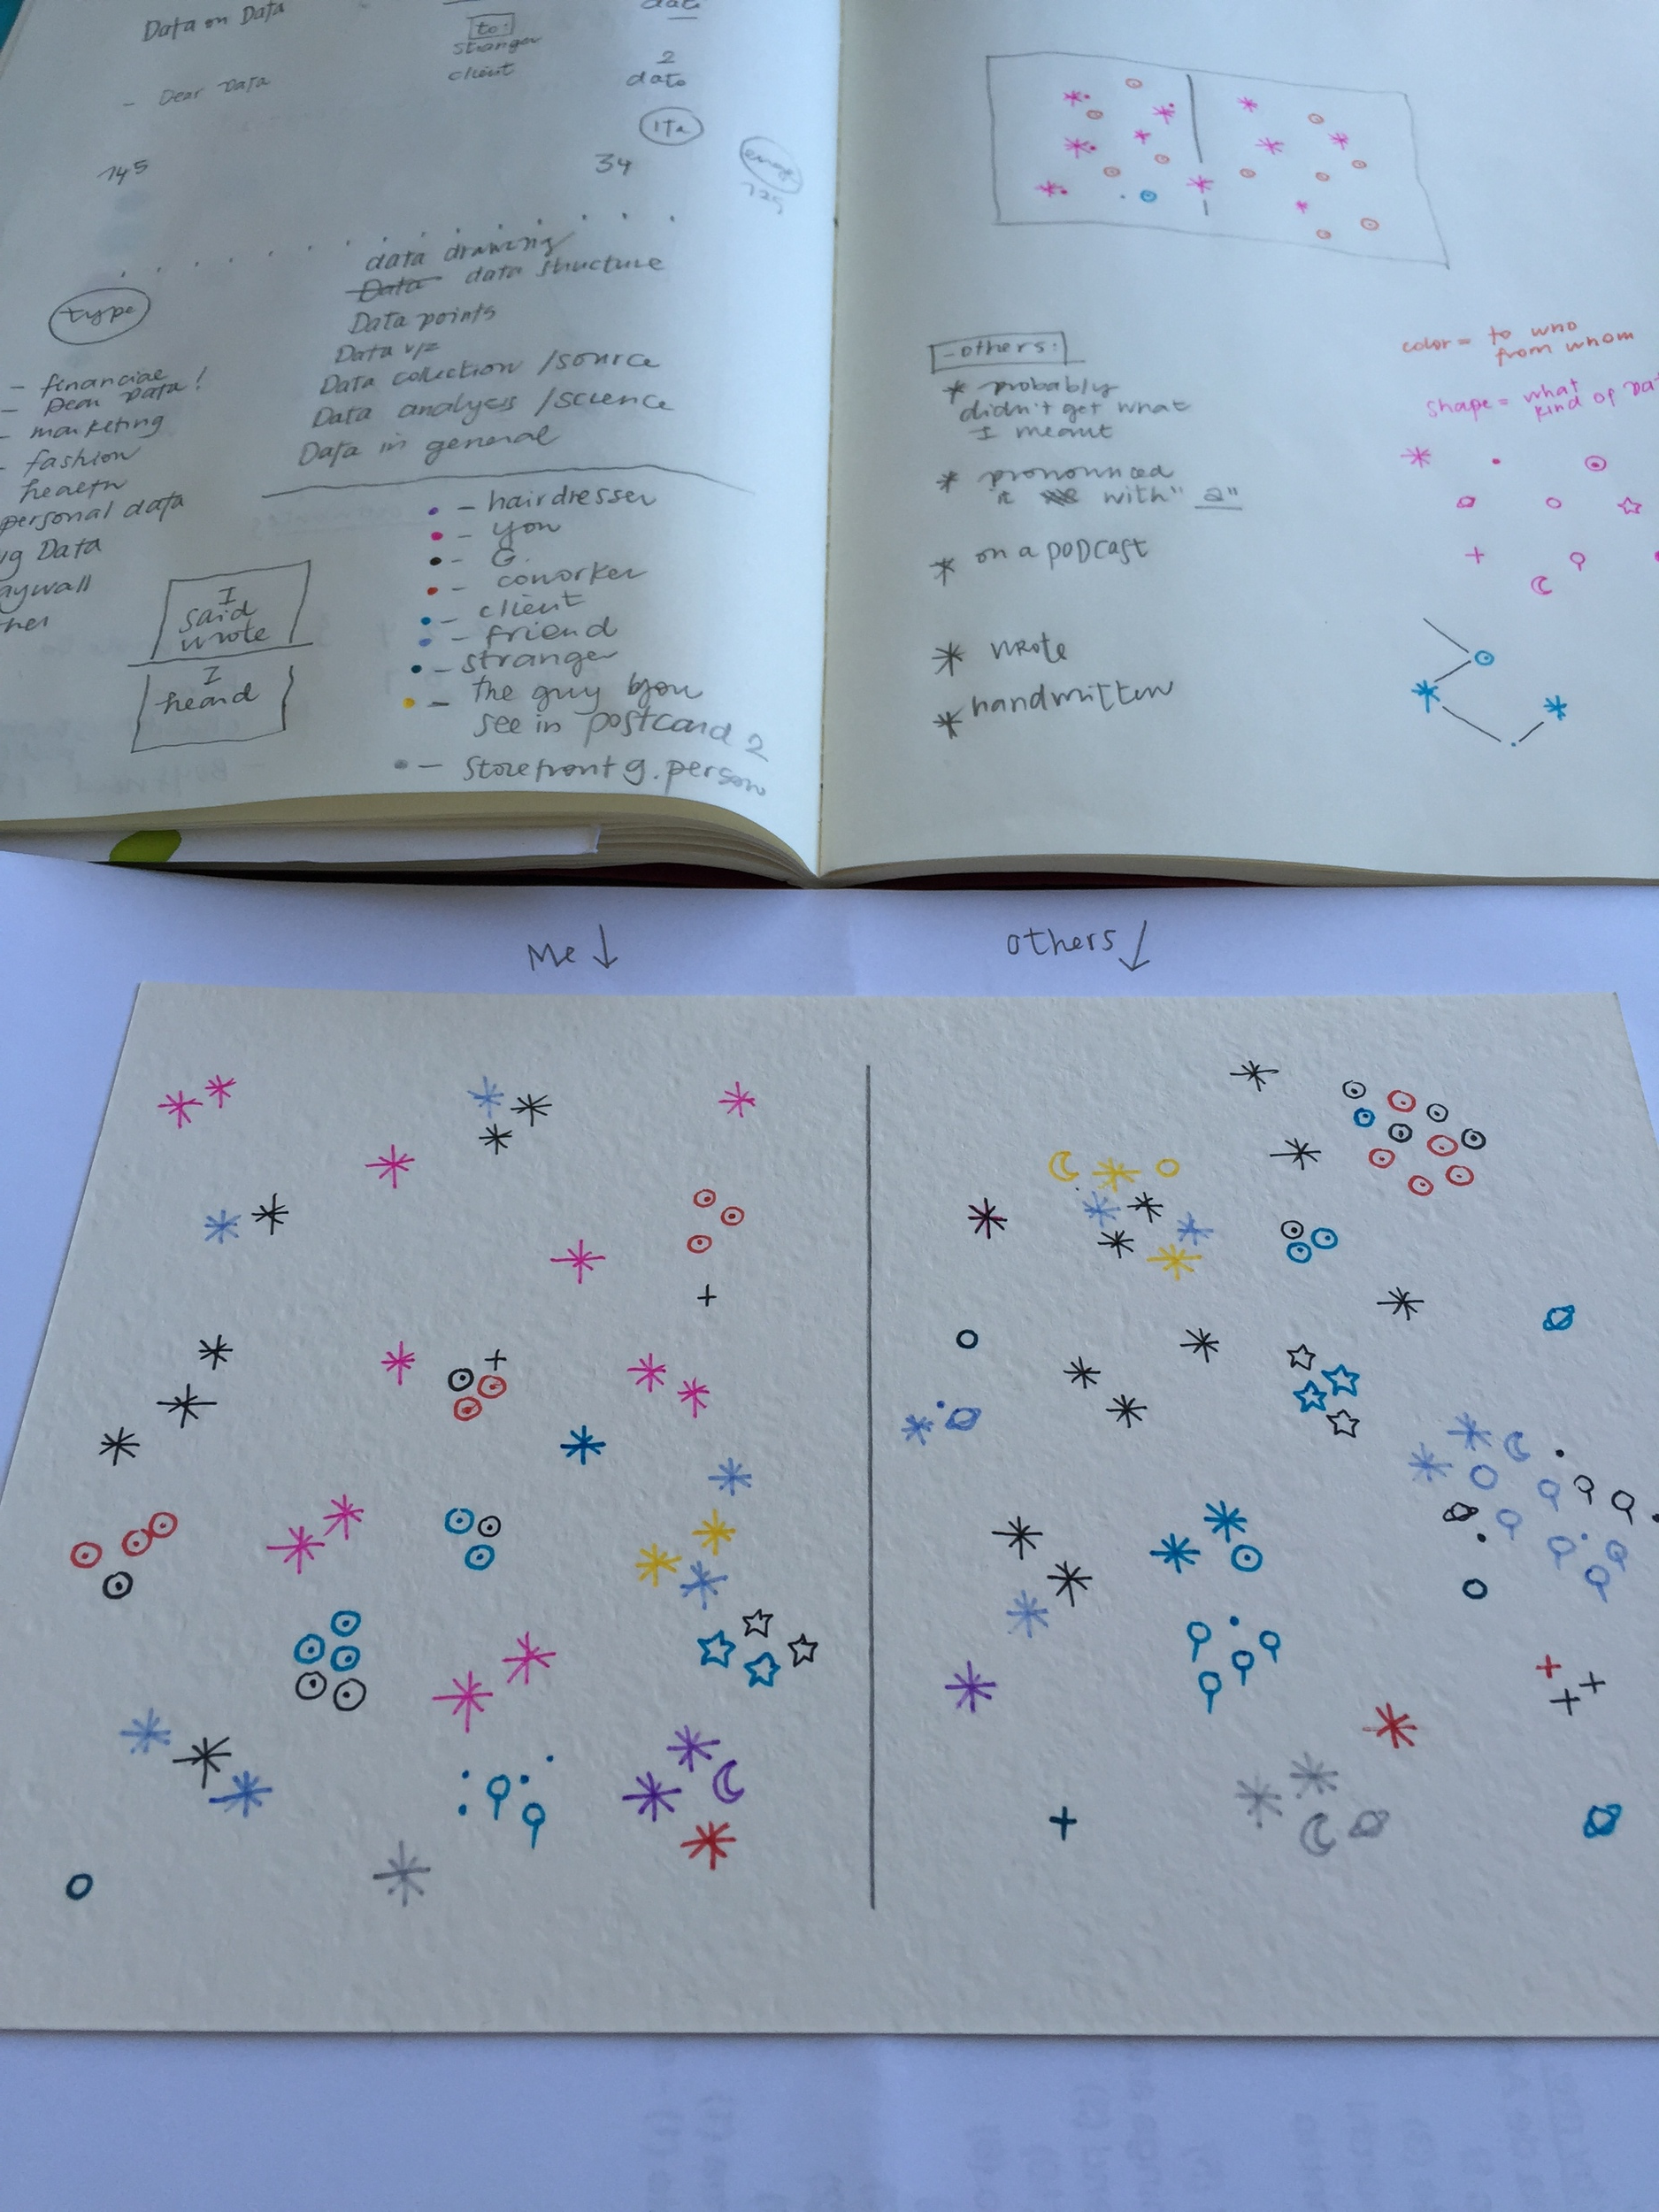
On the left part of my postcards sit “my data” and on the right side are the external ones grouped according to the situations, thus clusters of symbols indicate we’ve been mentioning the D-word more than once in a given situation.
I wanted to explore a bit with this the drawing for this postcard, I didn’t follow any strict rule for the organization of my data-data (ha!) but rather I’ve been guided by my aesthetic feeling to compose an (hopefully) elegant drawing. Every symbol represents a single time the D-word has been said, wrote, heard.
Different types of symbols indicate what kind of data (i.e. what were the number representing?) the conversation engaged on: were we talking about finance, marketing, advertising, personal data, “dear data” (:)) or other? Additional attributes such as colors and rounded circle illustrate who I was talking about data with, and special anecdotes, namely:
- hear 2 strangers in my cowering space simultaneously saying the word data from their two different workstations,
- spending a evening with our friend who was present in postcard 2 extensively covering personal data collection topics.
- trying to explain data visualization to my hairdresser while getting my hair cut, being sure she didn’t really get it (though while I mentioned Dear Data and how everything can be data in your life I could see a light bulb coming up above her head!)
At the beginning of the week I was also keeping record of the number of times I read the word data, but on Tuesday I decided it was just crazy (so many!!) and it didn’t really bring any value to our main question for the week.
I am having a major insight here Stefanie (at week 49!): probably we should have cooked the format for the data collection slightly differently, where the first day of the week would be for data-gathering-explorations around the topic, and the remaining 6 days would be the actual data collection.
What drives this thought is the difficulty of coming up with compelling questions for your data tracking before really digging into the topic and actually starting to collect. I have been trying to work around this obstacle by hoarding a ridiculous amount of details on my Mondays, seeing what I found more appealing, and defining the exact data collection from my Tuesday and on.
I also realized how the different annotating tools we use (our moleskines, our evernote or note app, or different tracking apps) influences our data gathering: setting up specific questions for our data collection at the beginning of the week brings to different kinds of results than jotting down our logs about the topic and finding data on it only afterwards.
In general, we always say that with Dear Data we’ve been wanting to explore the role that data can have in understanding our personal experiences and in telling stories of our lives from it, and looking at data as ways to raise new questions. Many people associate the “quantifiable” and “quantitative” with precision and objectiveness, and they are drawn to personal-tracking by the idea that this would solve some of their problems, and finding rational answers. We think these kind of investigations aren’t really about finding definitive answers about ourselves, they are more about raising novel and unexpected questions. Moreover, when we think about data in our lives we always associate it with more efficiency, more automation. We here argue we can absolutely use data to become more human, to connect with ourselves and others at a deeper level.
This week has been for sure very meta, and I love how Stefanie smartly reminded it in her postcard by counting the total number of time the word data has been mentioned in her postcard’s legend!
And well, this is a nice week’s topic to invite you to complement your reading with our recent interview on the Data Stories podcast! :)
The Process:


Stefanie
As we are nearing the end of our year in capturing and drawing our data, we have realised we well, talk about data... a lot.
And we are very aware that this is not exactly normal, but actually incredibly nerdy, and can only imagine what other people would think about us if they overheard our conversations.
(Well, I think I do know, as just the other evening, my long-suffering (non-data) designer husband heard a similarly-data-minded friend and I talking about data all evening at a dinner, then at drinks, then on the way walking home, then actively banned us from talking about data for the rest of the evening, which is fair, I think: there’s only so much a person can take, really.)
Anyhow, it seemed to be a topic ripe for data-gathering, so this week, the word ‘data’ was our data (oh, I have a feeling you will be tired of the word ‘data’ [Argh! I said it AGAIN!] at the end of this post)
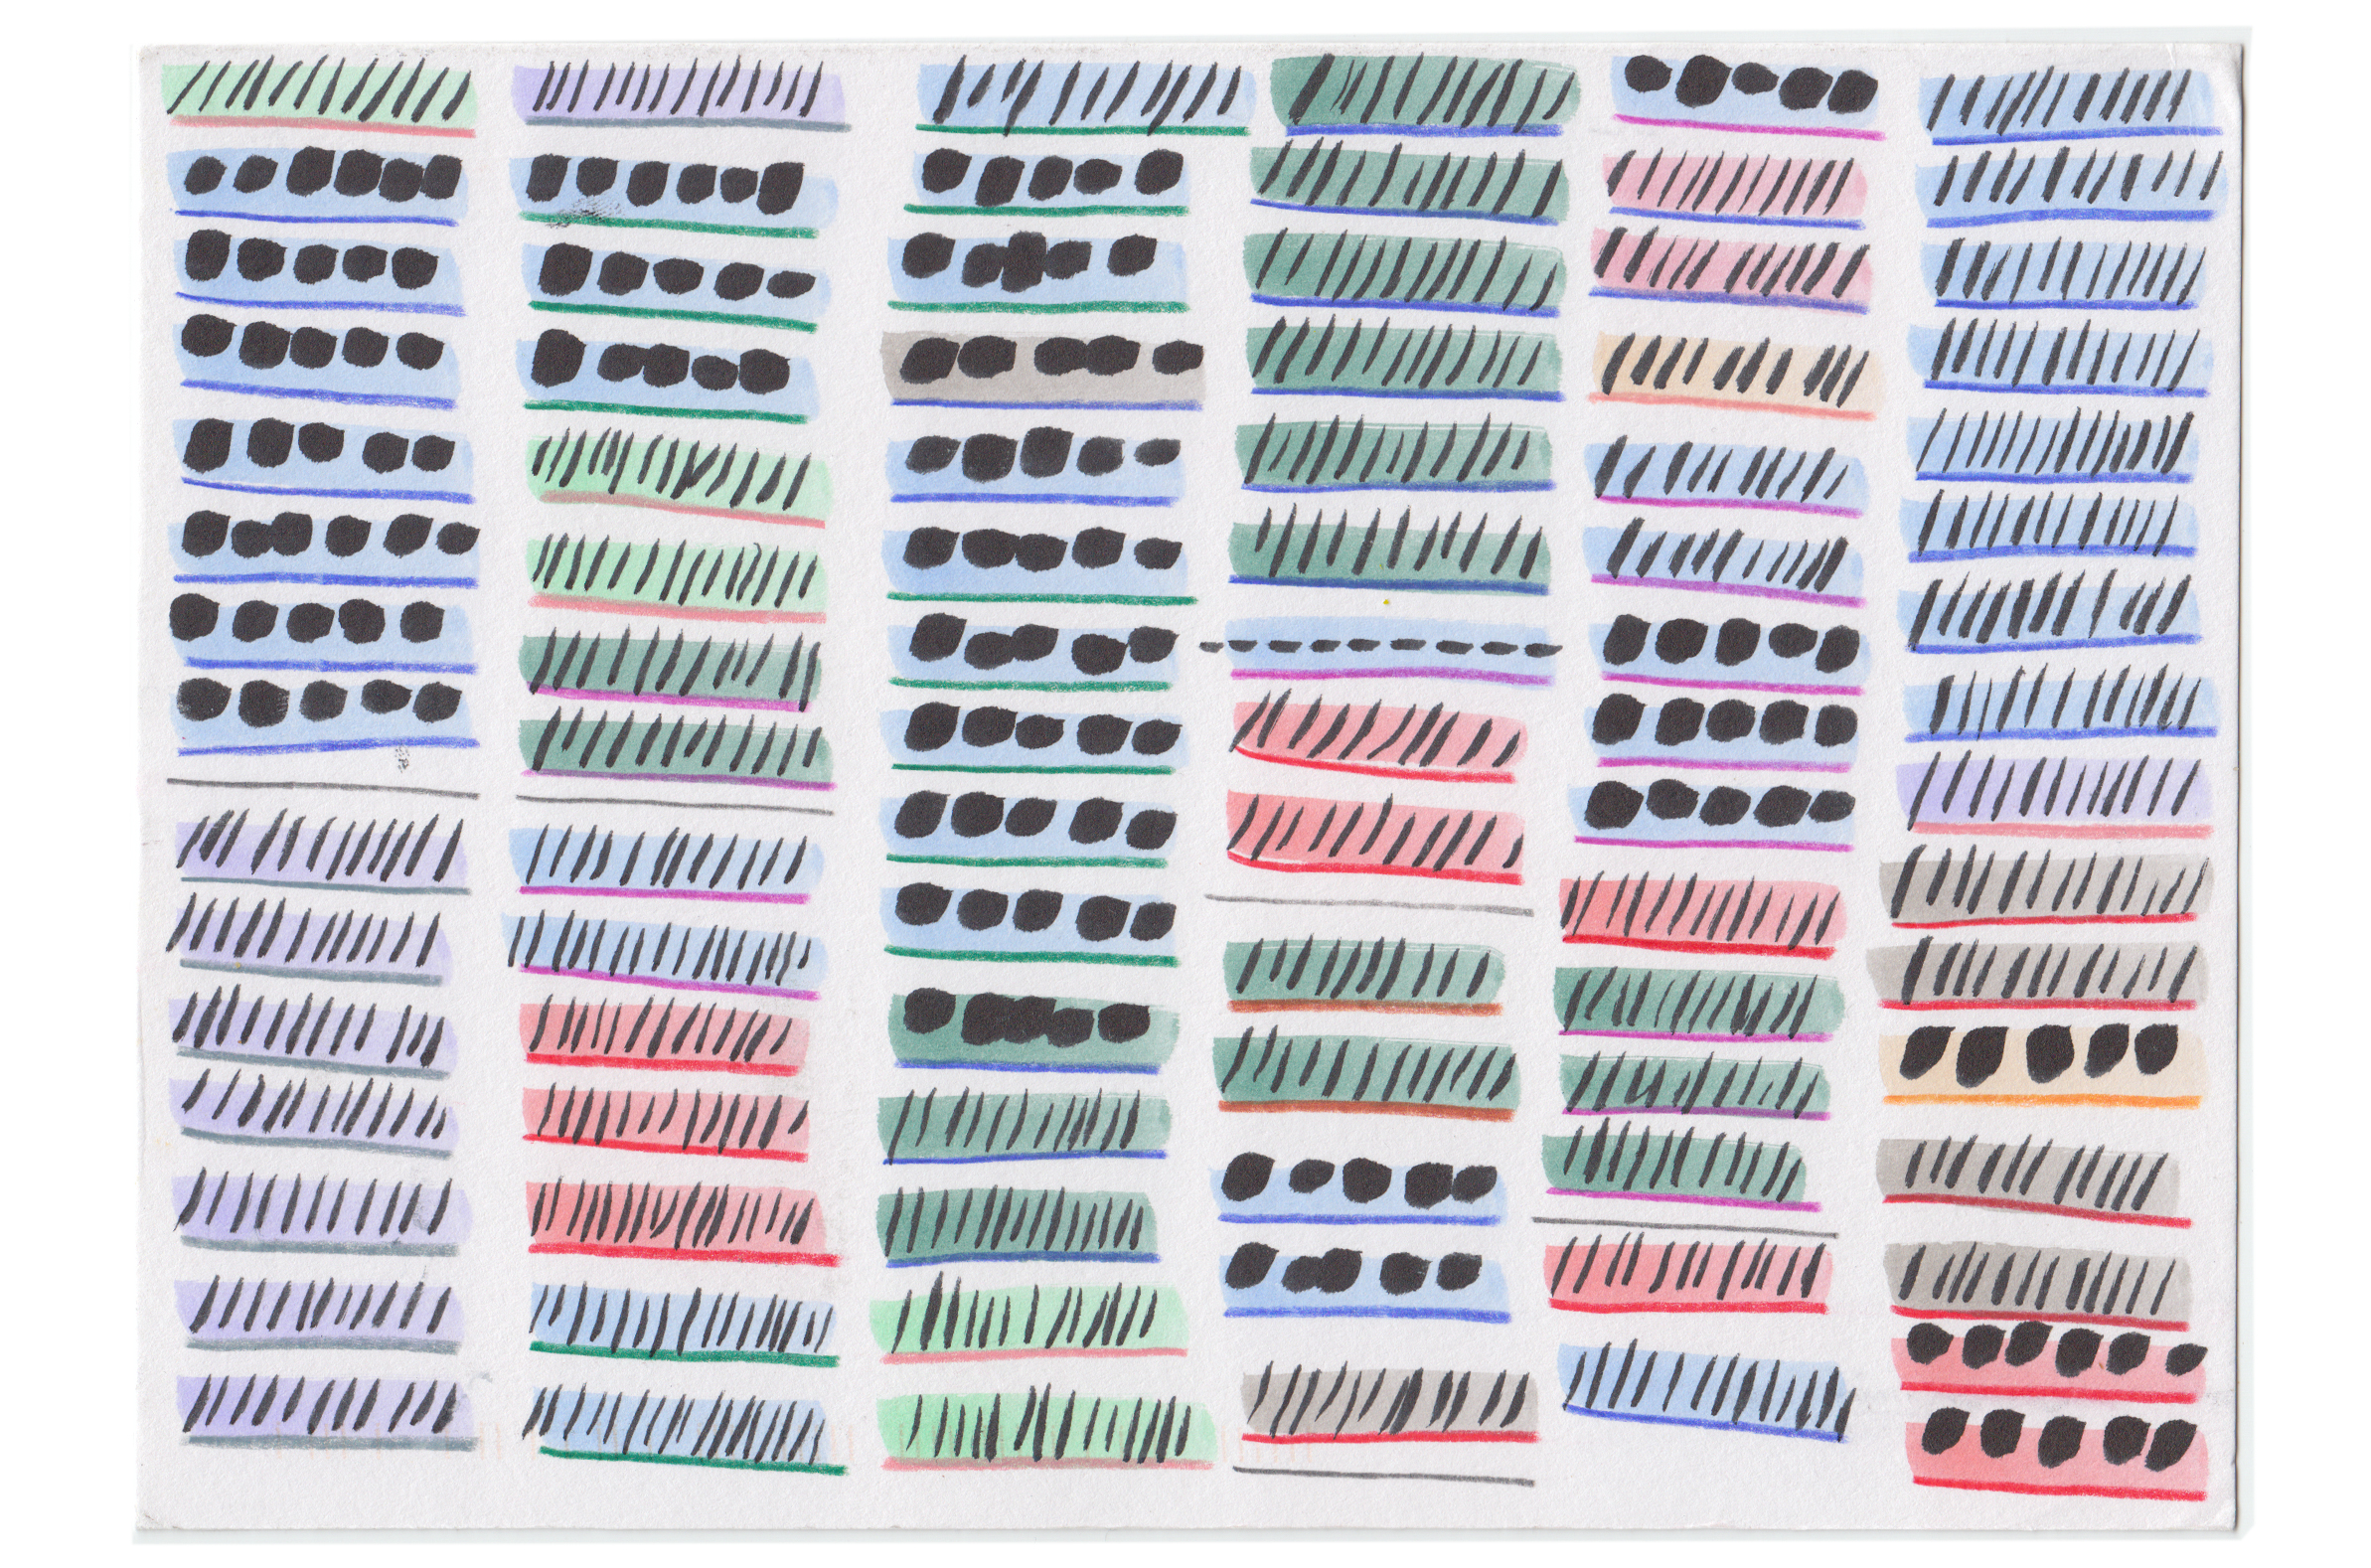
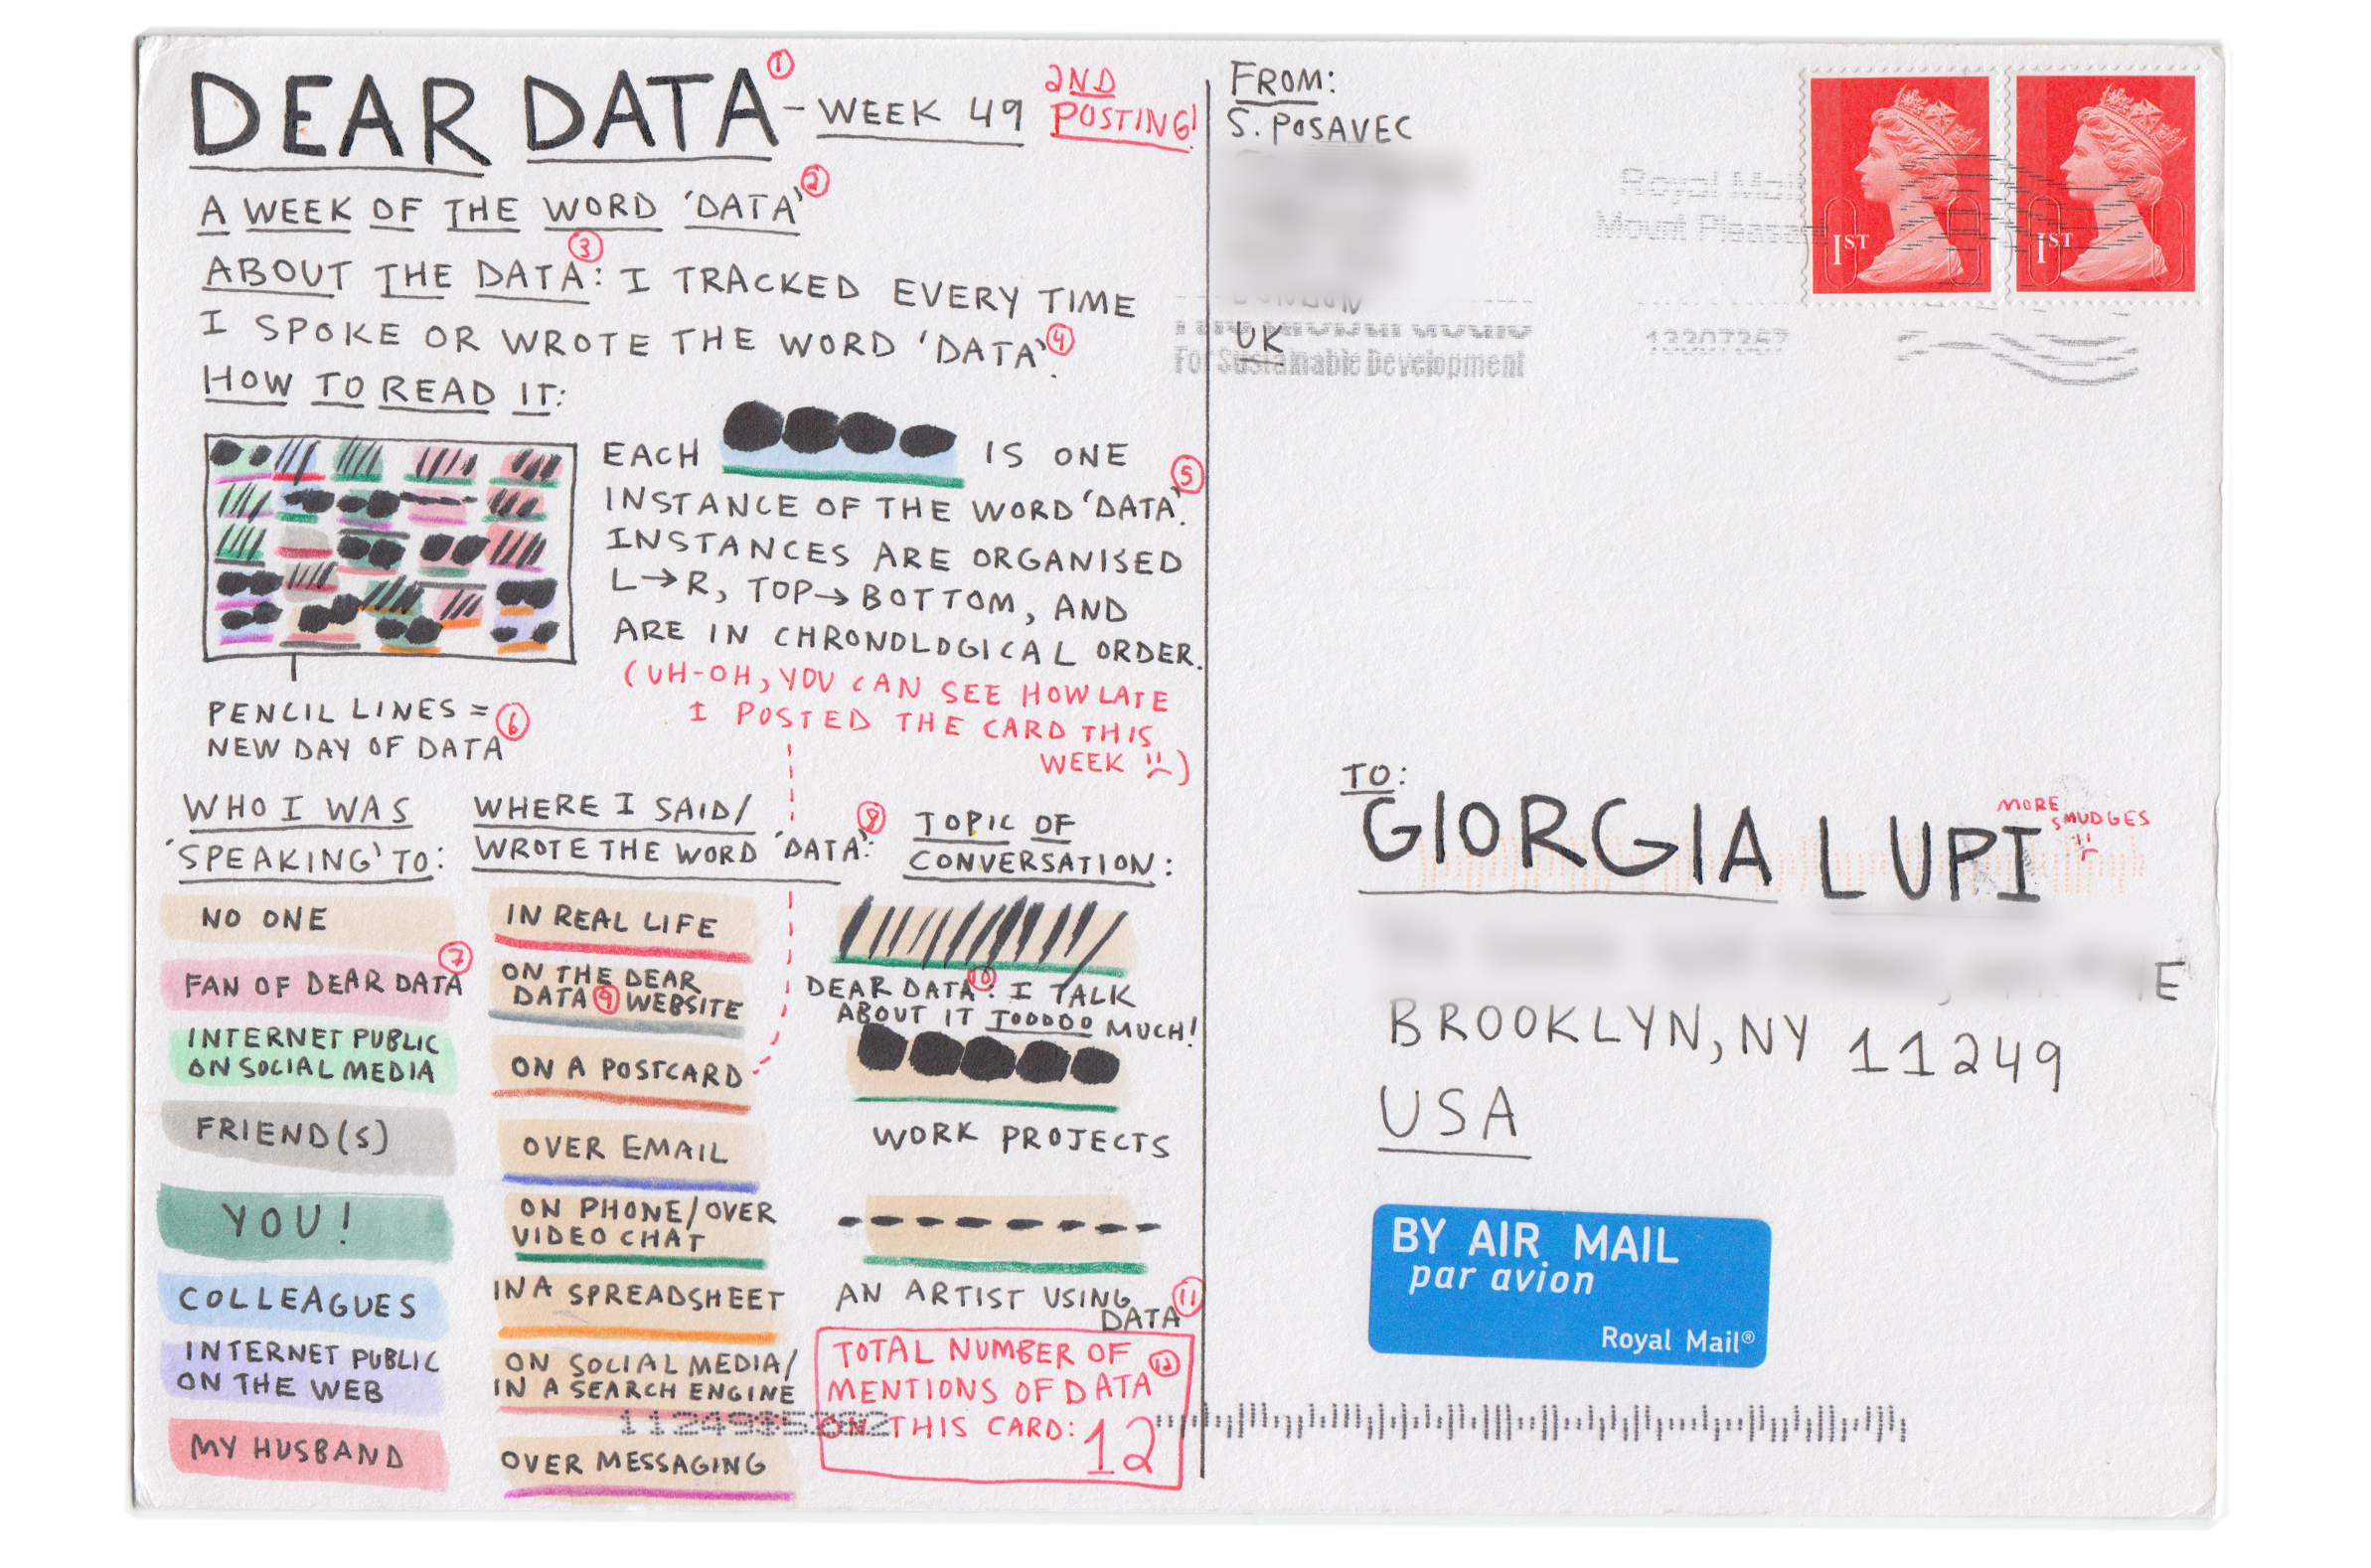
I chose to keep my data-gathering simple, in that I only gathered data on when I spoke or wrote the word data myself. Even just restricting myself to this very limited dataset was a challenge as this is a word that I say without even thinking so I have a feeling that I mentioned this word often in my workday without realising it.
Thankfully (for my husband, at least), it would be reasonable to conclude from this week of data-gathering that I mainly mentioned the word ‘data’ to my work colleagues, and not very often to my husband, so he’s gotten off lightly this week, at least.
And of course, no question, the ‘data’ topic that I spoke about most this week was Dear Data… it’s such a part of my life that I talk about this project so, so much, and I’m amazed at how much of my life has been taken over by this project. I have found it both stressful and exciting but regardless, as we near the end of this year, I am starting to feel both proud of what we’ve done and slightly sad that we will soon be finished.
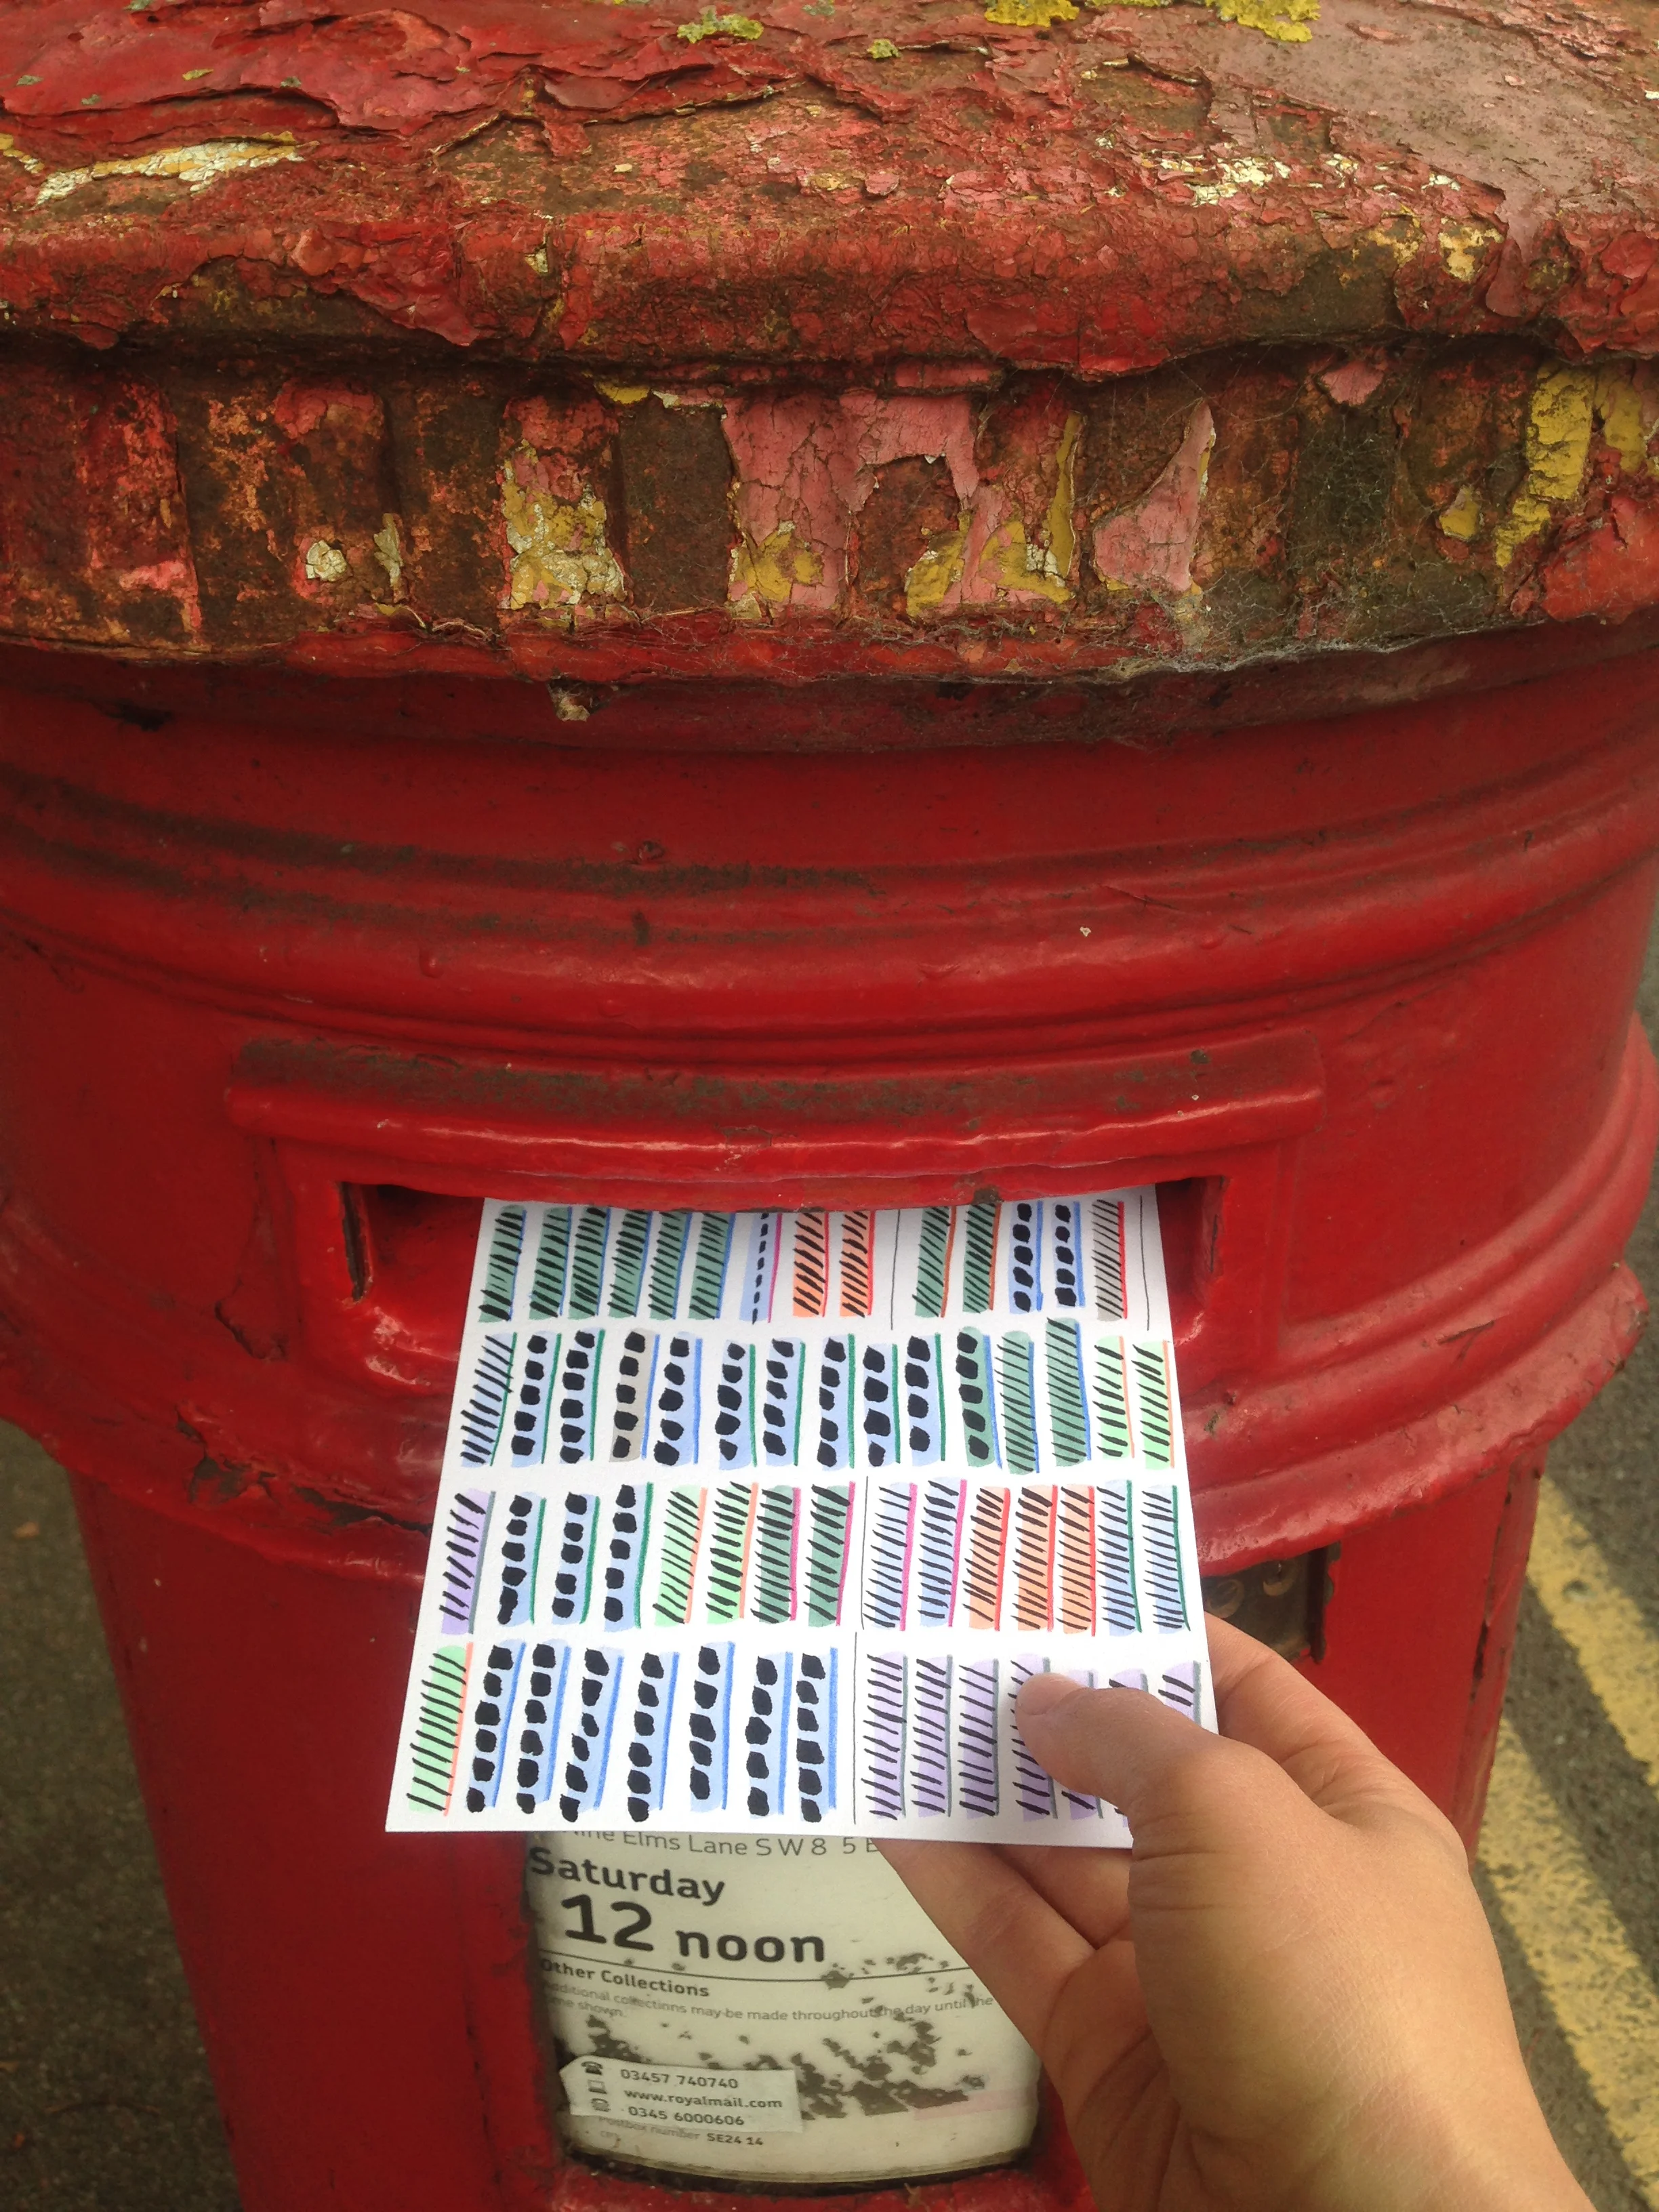
This is one of my favourite postcards, probably because I was using some nice pens and pencils that I recently bought and I love their ice-cream colours. I know this design doesn’t really ‘look’ like data should look, but here I was just using my data on ‘data’ as an input to output some nice patterns and have fun, though the information is still relatively accessible.
However, as is always the way, this card was lost in the post! So infuriating, particularly as this was one of the few postcards from our year that I’ve actually posted to Giorgia early. After waiting for some time, I finally gave up and accepted that the card wouldn’t arrive and re-drew this. Why do my most favourite cards always get lost? Like Giorgia has said earlier this year, I am assuming that it’s because the postman steals them due to them being his/her favourites as well.
And as per usual, Giorgia’s card is much more multi-dimensional than mine, and she gathered more complex data on the word ‘data’. I love that she talks to her hairdresser about data, which is exciting: that maybe through this project focusing on more domestic, mundane data, we might be able to make data more accessible to a wider audience. Also, I see that she talks about Dear Data as much as I do, and it makes me feel better to know I’m not the only one annoying my friends and partner!
Total number of times I mentioned data in this post: 26 (oh, dear)